Examining Hospital Price Transparency, Drug Profits, and the 340B Program 2021
Introduction
The United States spends 17.7% of its GDP on health care related expenditures, far above its developed market peers, who generally spend no more than 12% of their GDP. This excess health care spending added costs are an enormous burden on the U.S. economy and ‘crowd out’ important necessary spending on areas such as infrastructure, education, and social programs. It is broadly recognized that much of these costs are the result of inefficiencies in the U.S. system.
One of the fundamental tools suggested to understanding and addressing excess spending in the U.S. health care system is pricing transparency, as better visibility and understanding of costs will ostensibly drive organizations and individuals to make more cost-aware health care decisions, leading to a decline in the use of overpriced goods and services.
To help improve the shift towards greater health care transparency, the Community Oncology Alliance (COA) commissioned analytics and consultancy firm Moto Bioadvisors to examine compliance with, and insights from, recent hospital price transparency data, with a particular emphasis on oncology and the 340B Drug Payment Program.
Assessing Hospital Compliance with the Centers for Medicare & Medicaid Services (CMS) Transparency Regulations
The regulation enacted to drive hospital price transparency. Hospital spending represents 31% of national health care spending and is the largest area of health spending in the U.S. (source). The historical lack of transparency in U.S. hospital prices has been suggested to be an important driver of higher U.S. hospital prices. As part of the Affordable Care Act (ACA), Congress enacted section 2718(e) of the Public Health Service Act, which requires hospitals to “make public (in accordance with guidelines developed by the Secretary of the Department of Health and Human Services (HHS)) a list of the hospital’s standard charges for items and services provided by the hospital.” CMS initially required hospitals to only make their list prices available (the ‘chargemaster’) but, realizing the chargemaster is ineffective in providing buyers and consumers with effective transparency, CMS revised its guidance in November 2019.
The finalized CMS hospital price transparency regulation requires, among other items, that hospitals publish a “machine-readable” file containing prices for all “items and services” provided by the hospital to patients for which the hospital has established a standard charge. These published prices must include (i) the chargemaster price, as in prior regulation, (ii) price for cash paying customers, (iii) de-identified minimum and maximum negotiated prices and, critically, (iv) payer-specific negotiated charges, which is the rate that a hospital has negotiated with each third-party payer.
The hospital industry has heavily lobbied against the regulation during its notice and comment period and the American Hospital Association (AHA) challenged the rule in court, arguing the law only mandates the publication of chargemaster prices. However, the court ruled for CMS and the new regulation went into effect on January 1, 2021. Post the regulation coming into effect, the AHA continued to argue for its cancellation and leniency in enforcement. We note the regulation also contains a specified civil penalty for non-compliance of up to $300 per day ($109,500 annually) – an insignificant amount for most U.S. hospitals. As discussed in this report, compliance with the law is quite poor. More recently, CMS has noted plans to significantly increase these penalties which may assist in improving compliance.
340B hospitals as focus of transparency interest. The 340B Drug Pricing Program was created in 1992 “to enable [covered] entities to stretch scarce Federal resources as far as possible, reaching more eligible patients and providing more comprehensive services” although a more precise definition of the program objective is lacking. The program requires drug manufacturers to provide qualifying institutions with discounts on their purchasing of outpatient drugs according to a formula prescribed in the law as a condition for participation in the Medicaid program. Essentially all drug companies opted in. While estimates vary, the minimal 340B discount is 23.1 % and a recent CMS study found the average discount is 34.7% vs. the prevailing U.S. commercial price, known as Average Sales Price or ASP (source).
The eligibility criteria for qualifying 340B institutions have been expanded several times. The largest group or participating entities in the 340B program have become disproportionate share hospitals (DSH). They represent 40% of U.S. hospitals and were responsible for 78% of drugs purchased under the 340B program in 2015 (source). Per recent disclosure, the value of the drugs purchased under the program was estimated at ~$38B (source), and given the drugs purchased are discounted, it reasonably accounts for a share of the U.S. drug market in the low teens, by volume.
The program has been the subject of much debate, with critics pointing to several major deficiencies:
- Lack of supervision and accountability for such a large program.
- Aggressive efforts by hospitals to leverage their 340B status, e.g., by directing patients using high-profit drugs to 340B eligible units, use of satellite offices to increase the reach of 340B units, and use of contract pharmacies to distribute drugs.
- The discounts are applied to the institution, not the patient in financial need. Thus, low-income patients treated outside 340B hospitals do not benefit from the discounts and 340B hospitals obtain discounts on drugs even when treating fully insured patients and obtaining negotiated rates.
- Community physicians have noted the institution-wide 340B discount is putting them at a competitive disadvantage.
The availability of transparent hospital prices offers an opportunity to make the debate on 340B hospitals more informed, using actual data on the negotiated prices hospitals charge insurers and patients for the drugs they acquire at discounted prices under the 340B program. While there is no requirement for 340B institutions to pass along the discounts they obtain (they may use their obtained discounts to fund operations or programs that benefit the community), it is certainly logical for them to do so. At the very least, one would expect a reasonable markup that allows the hospital to retain some of the profits for other programs, but also serves the (presumably lower income) local community interest in (i) obtaining lower cost insurance, as rates are dependent on local medical expenses, including drugs; (ii) paying less out-of-pocket (OOP), as OOP costs are often derived as a percentage of the negotiated hospital rates; and (iii) for those who need to pay cash, obtain their drugs at an affordable rate. In this analysis, we use 340B hospital data obtained as a result of the CMS transparency rule above to try to add to these debates.
What We Did: Methodology and Data Challenges
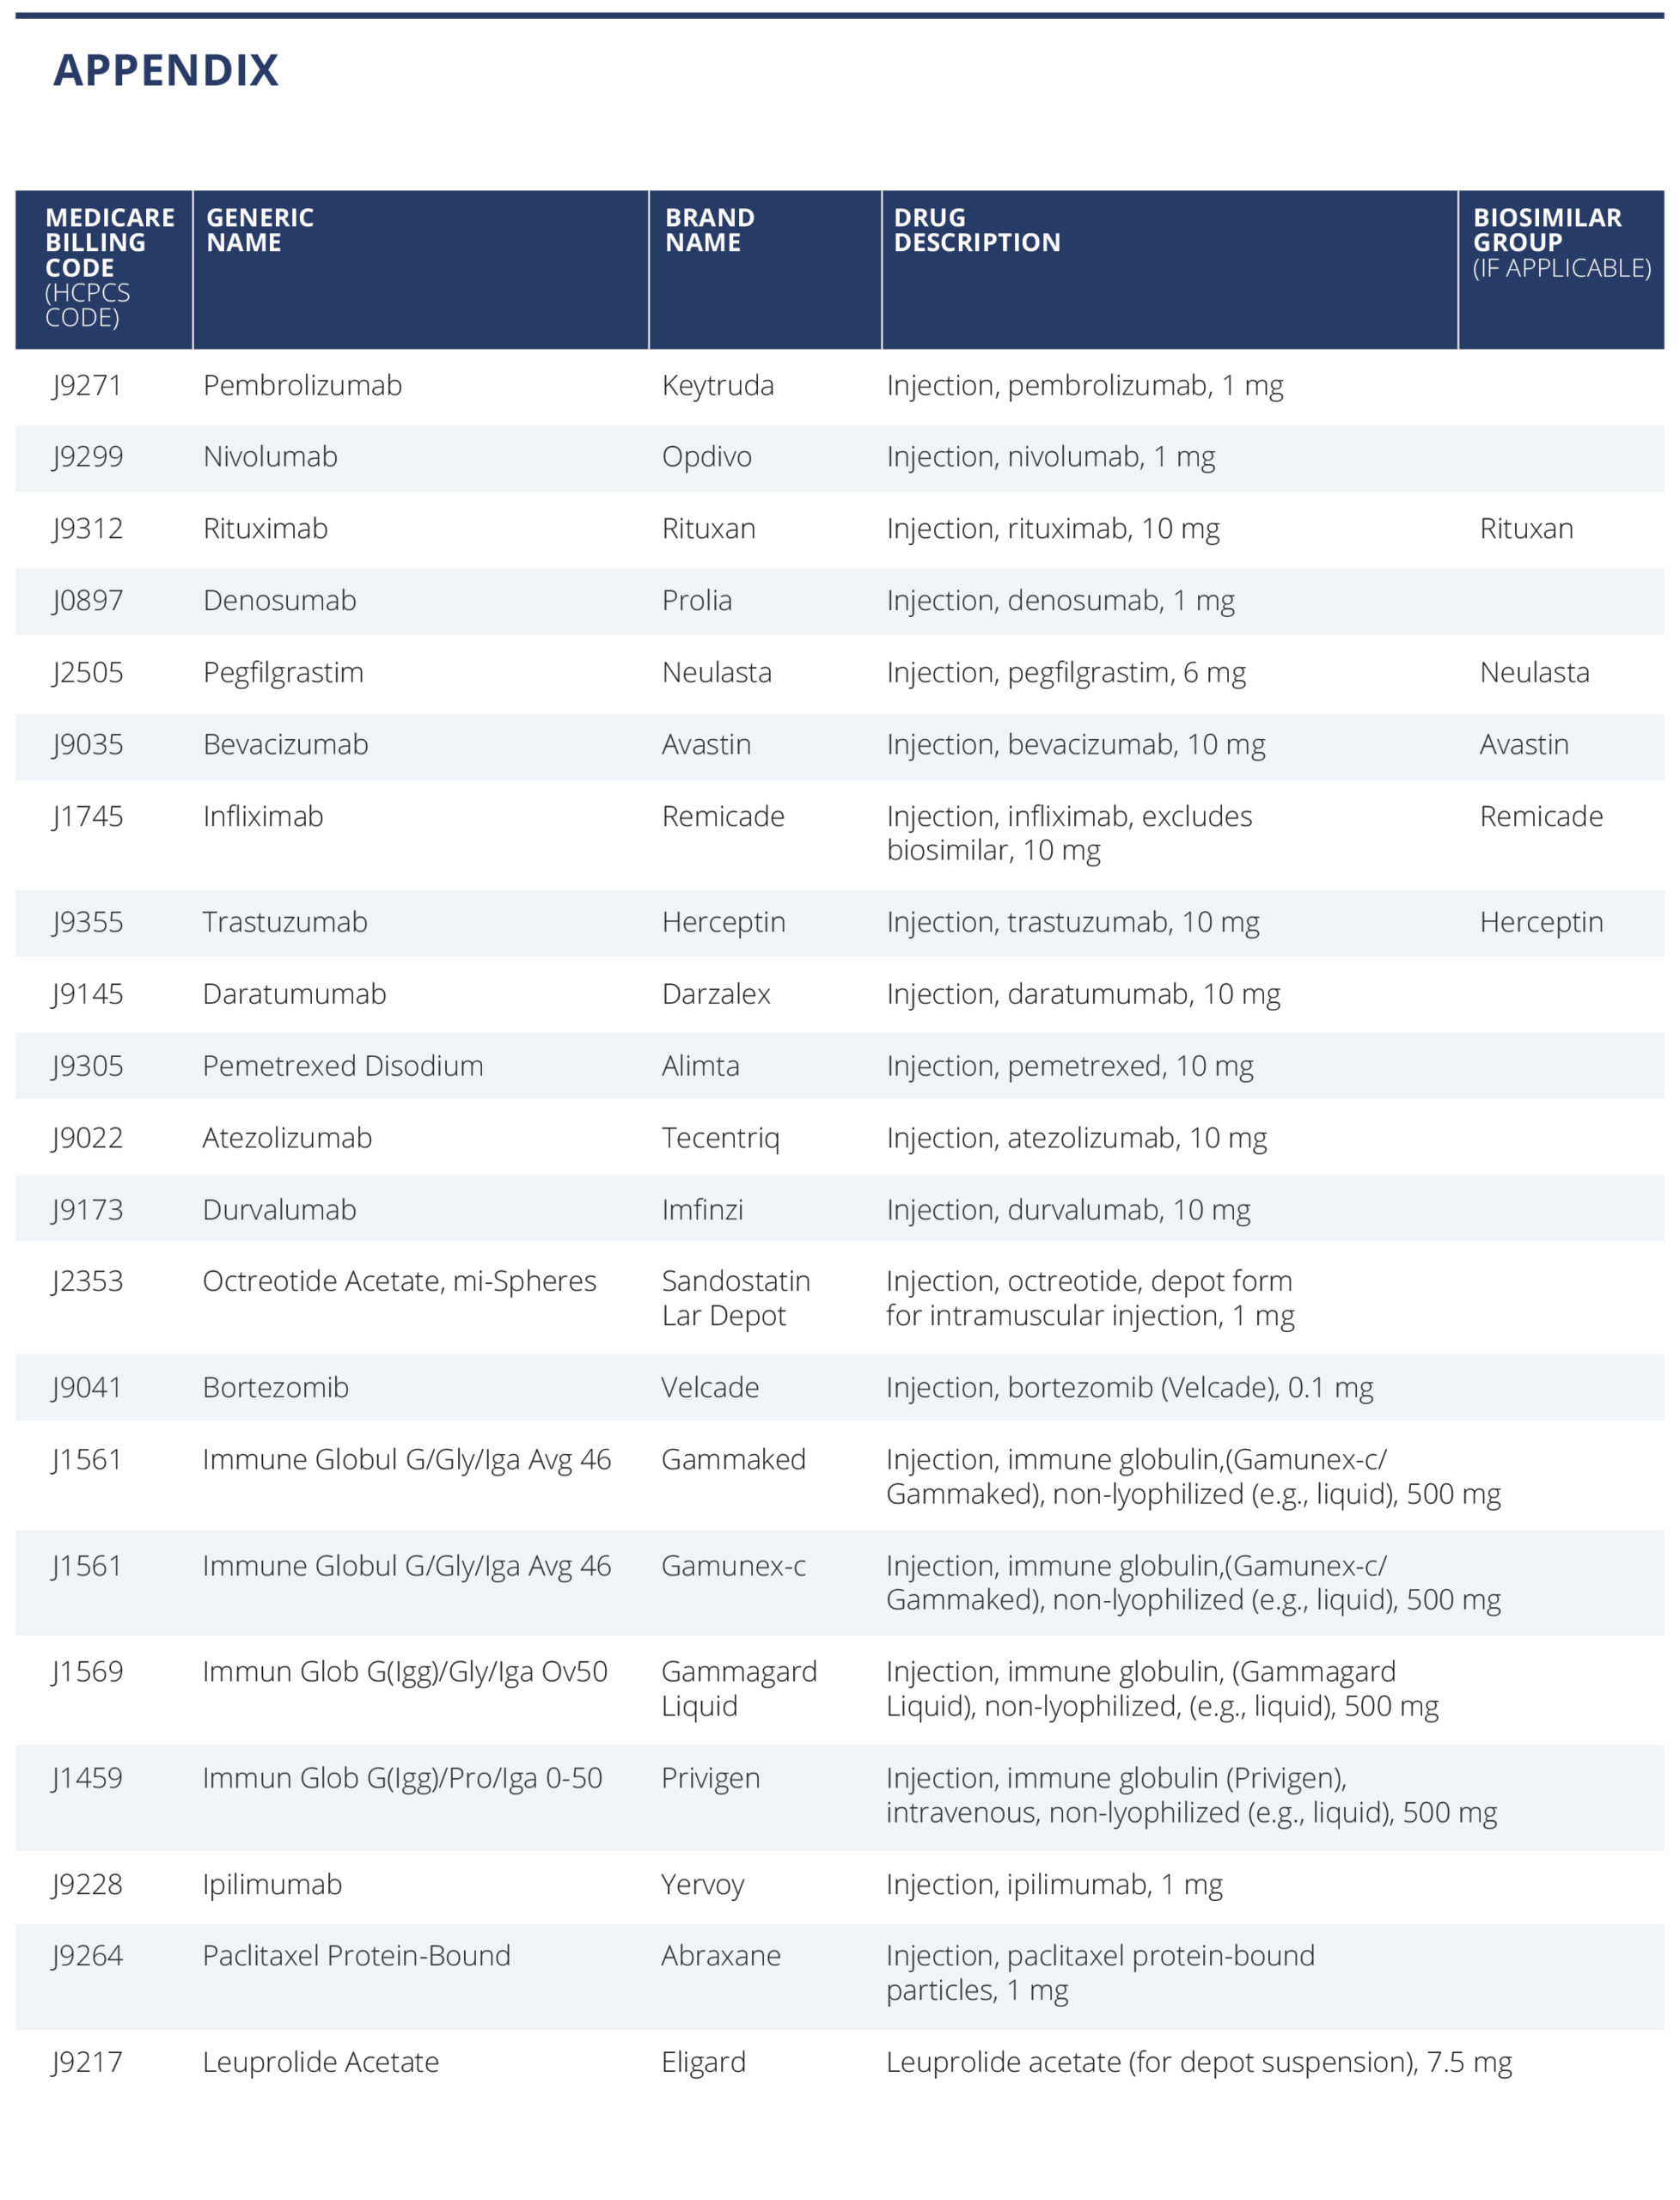
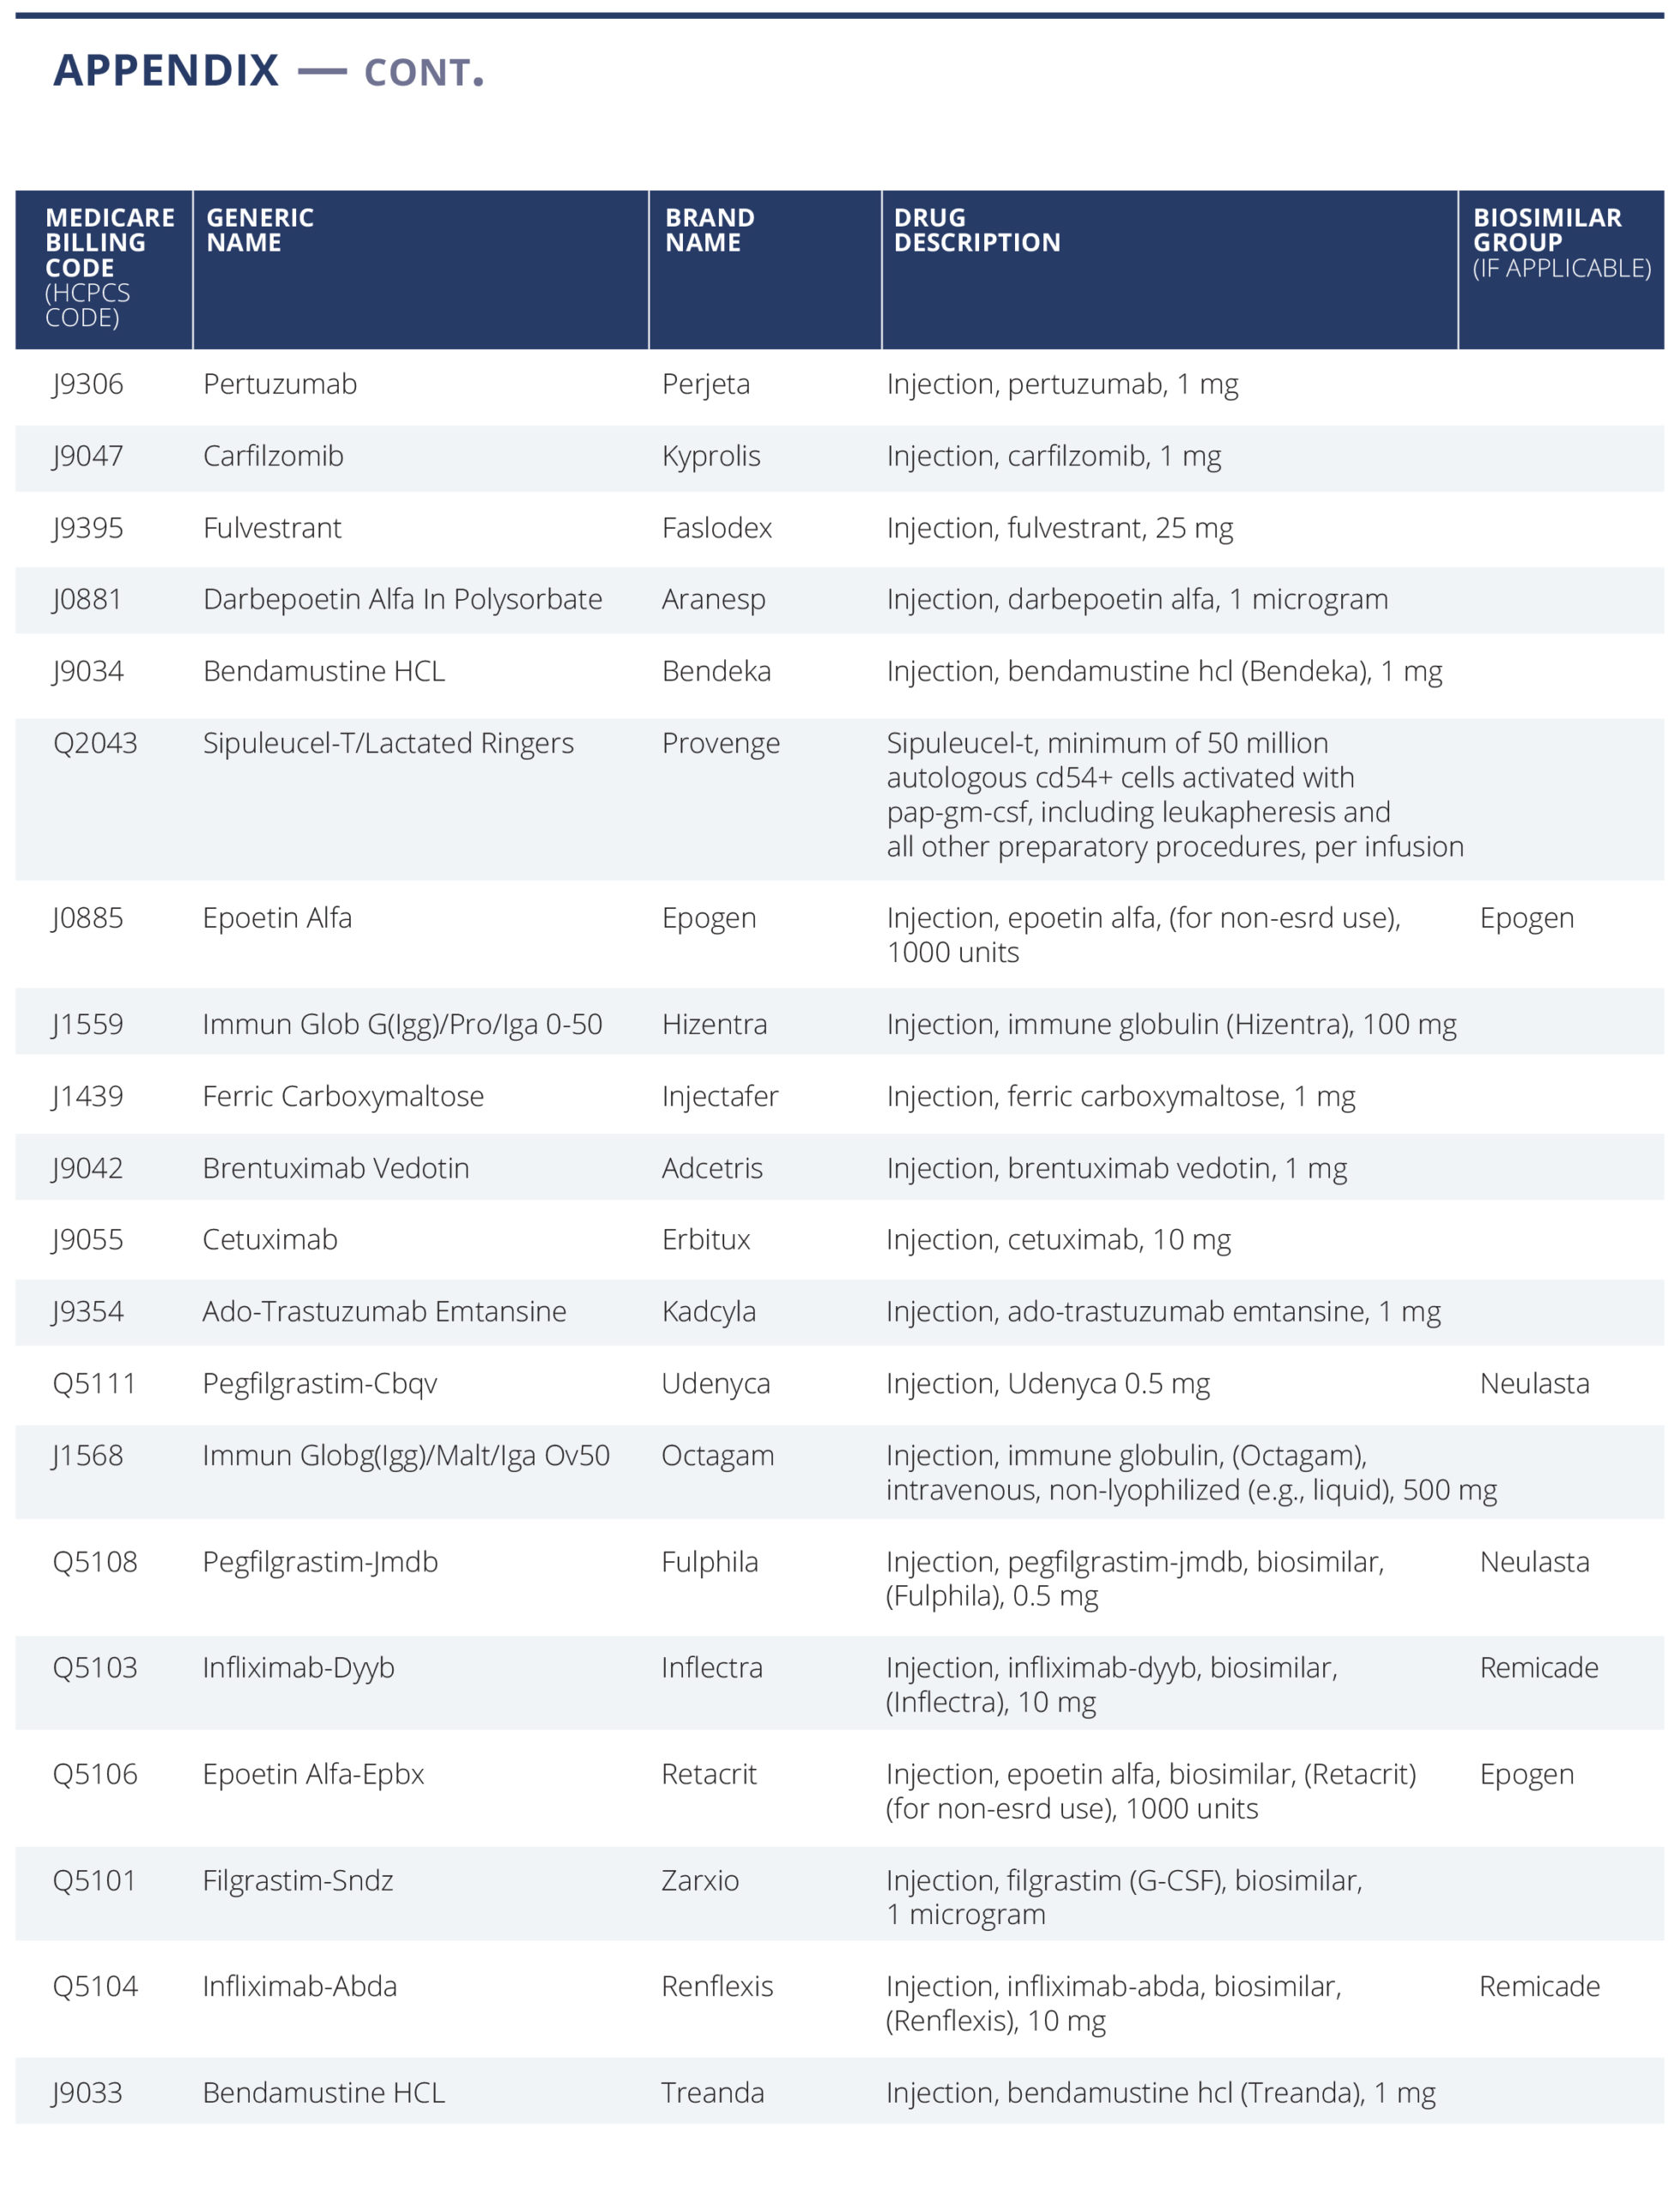
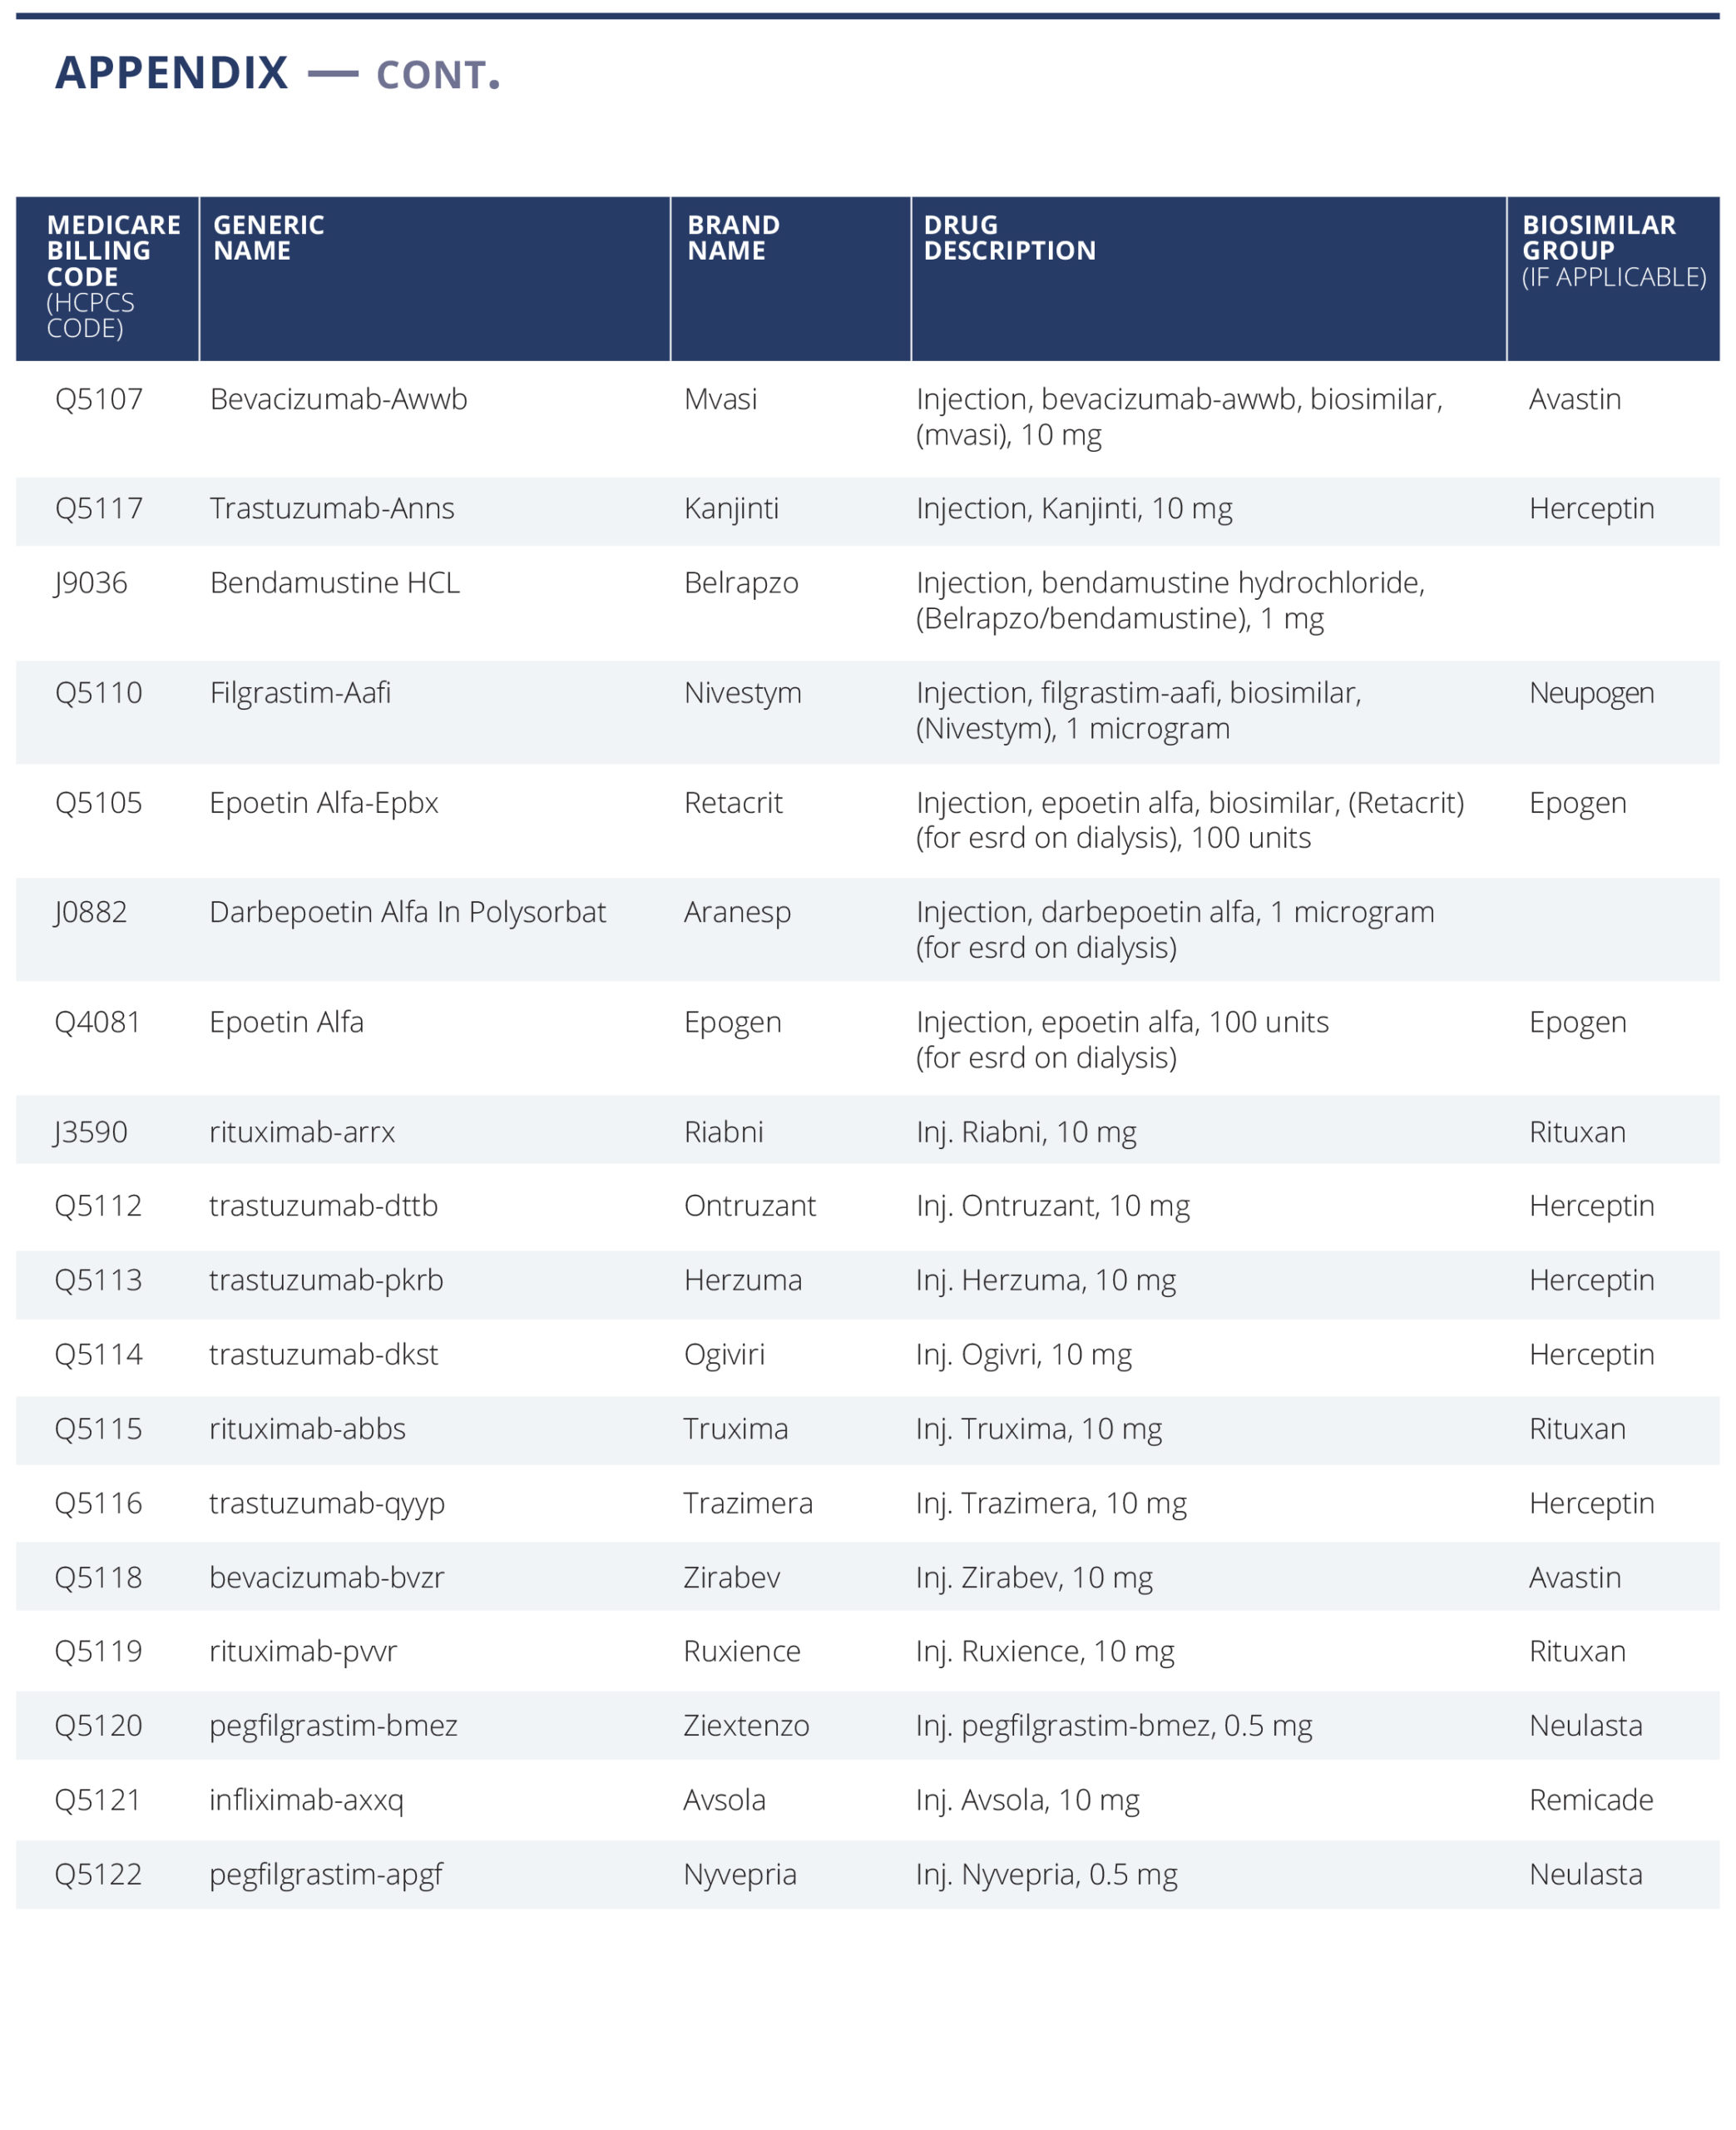
We have selected a list of 59 oncology treatment and supportive drugs to study (see Appendix). The drugs were selected primarily based on being the highest dollar expenditure for Medicare Part B drugs in 2019 (link) augmented with lower expenditure drugs sharing the same active ingredient, either generic or biosimilar. (For example, Ontruzant was included to complete the list of the trastuzumab family of drugs).
We then obtained a list of 1,087 acute care 340B DSH hospitals. In April 2021, we searched each of the hospital websites for the price transparency file, finding that 890 had published such a file on their website, with 876 files available for public access. We then analyzed the data to ascertain if it attempts to comply with the new (January 1, 2021) HHS hospital transparency regulation, or instead only provides chargemaster data required by the pre-2021 regulation. If any price data relevant to the new regulation was found in the data file (e.g., minimum price, cash price), we considered it ‘attempting to comply.’ Only 327 of the hospitals in the 340B program attempted to comply with the new transparency regulation.
We then searched each hospital file that attempted to comply with the new regulation for inclusion of drugs, considering the possibility that some hospitals do not include drugs either because they are organizationally managed separately or, being aware of the controversy of drug markups and 340B drug discounts, chose to eliminate them. If the file mentioned either of the three largest oncology drugs (Keytruda, Rituxan, and Neulasta) either by brand, generic name, or Healthcare Common Procedure Coding (HCPCS) code (J code), they were considered to include drugs. Of the 1,087 340B hospitals, there were 233 hospitals that included drug prices. Last, as we began to process the files, we realized some had not included individual negotiated payer data required by the new transparency law, but rather only, cash price, minimum, maximum, and chargemaster prices.
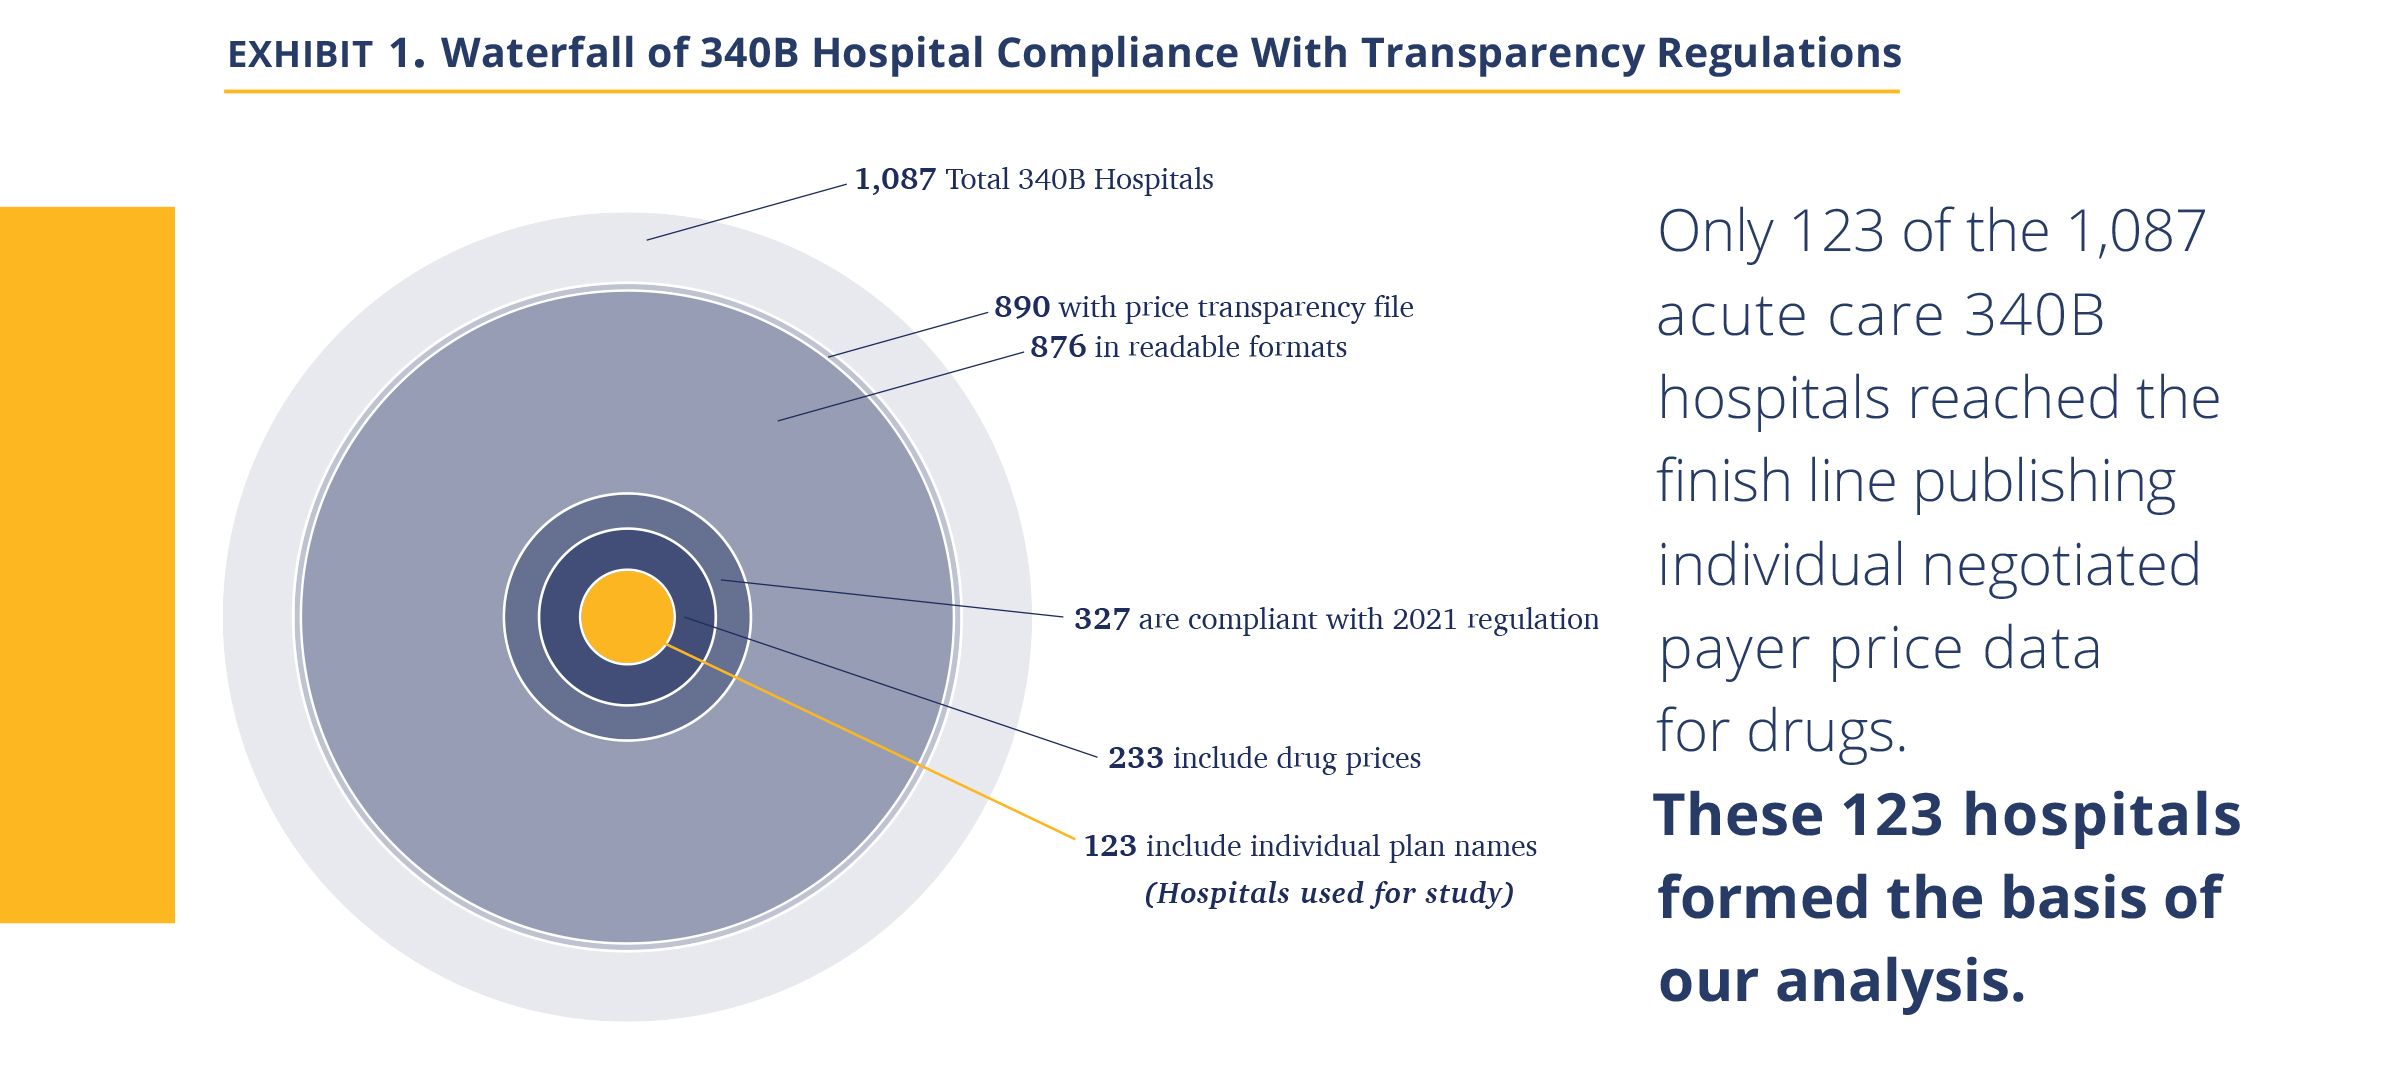
Analyzing the 123 hospitals, we observed that the majority of them did not provide well-organized and easy-to-read datasets; instead, they seemed to be snapshots from internal billing systems. They included additional data unrelated to prices, multiple entries for the same products, and cost modifiers. The coding was inconsistent (e.g., some products were coded in different lines under their branded and generic names) and codes often reflected internal nomenclature. In some cases, hospitals coded missing data using their own convention (e.g., $.001 meant N/A). Further, the drug amount associated with the negotiated price was often unclear (e.g., 1mg or 1 vial containing 6 mg). As our objective was to create a standardized price dataset across all hospitals, we spent substantial time developing methodology to standardize the data. We removed unreasonable data points (such as charging $0.01) and addressed ‘duplicates,’ such as different dosages. The resulting database is thus impacted by our judgement and contains 52,180 data points across the 123 hospitals. We note our task was simplified by drugs being a rather uniform product with relatively clear nomenclature and standard dose. We suspect others attempting to develop similar databases for more complex hospital services are facing a much more challenging task.
Suggestions to Improve the Hospital Price Transparency Reporting Data
President Biden’s executive order issued July 9, 2021 instructs the HHS Secretary to “support existing price transparency initiatives for hospitals”(link). As we have recently analyzed the data, we offer few suggestions to help with this effort. The best solution, in our view, is for CMS to create a database that it will own and manage. Hospitals, rather than publishing their own files, would upload the data to the CMS database based on provided HCSPCS code and unit size. We believe this will create a clean and consistent dataset and make it easy to aggregate and analyze the data and save substantial system costs, as individual hospitals will not need to create their own databases.
To the extent this solution is not accepted, and hospitals continue to publish their own pricing databases, we suggest CMS amend its requirement as follows:
- Central data location. Rather than posting files only on their website, hospitals should also upload the file into a central repository created by CMS where it can be accessed (analogous to standard shared-drive website). This would require minimal effort by the hospitals and ensure easy access to the files.
- Data qualification process. CMS reviews the data for minimal compliance with the regulation. A file must be readable with a standard format and contain required minimal data (names of services, individual payers). Data is certified as compliant as of the given date. Our experience is that such review requires ~30 minutes per file (or one FTE for the ~3,000 acute care U.S. hospitals). This would encourage compliance and create clarity for hospitals that provide the data and those that do not.
- Only report negotiated price data. Move the hospital data from a database ‘dump’ to a price database – no other data, such as amounts billed to the payer or price modifier, are to be included.
- Deepen data standardization. The clearest benefit here would be a requirement to report products/services with their HCPCS codes and HCPCS unit size. Product description should have a unique and single cell used per data attribute (we often ran into a single cell describing the product, amount, health plan, and site of care). We would also argue hospitals should use standard nomenclature to indicate inpatient/outpatient use and line of service (commercial, Medicare).
- Require specific data schema. The current regulation defines which information ought to be published but does not specify the X-Y organization, order of data presentation, headers, terminology, and naming convention. It makes it virtually impossible to aggregate the data from different hospitals and compare without material manual adjustments. We suggest that CMS should require a specific data schema for all hospitals to comply with in order to be in compliance with the regulation.
While the modifications suggested above will be very helpful for industry companies attempting to achieve a measure of price transparency into hospital prices, it is absolutely essential for patients attempting to compare prices across several institutions. As presented today, a patient with co-insurance paying a percentage of oncology care costs would categorically not be able to obtain and compare the cost of oncology drugs across local hospitals to their specific health plan (and as we discuss below, the difference between institutions is very material). This view was echoed by others who have attempted to evaluate the data.
Last, a word about the limitation of the dataset. The first and most critical is that we are limited by the quality of the data the hospitals provided. We attempted to ensure the data correctly reflect specific hospital negotiated prices, but presumably errors slipped in given the complexity discussed above. We thus believe the data is best viewed on an aggregate basis, rather than focusing on individual hospital-drug-plans. We specifically avoided outlier data by using primarily median values. We believe the error rate in our data is low enough for median values to fairly reflect 340B hospital’s negotiated prices. The second is that this is price data. We do not have the volumes transacted at each price. Thus, to the extent a hospital transacts most of its business at a below-median negotiated price, this would not be reflected in this data. Third, for the dataset to reflect a price point, there must be a negotiated price. To the extent a hospital provides a drug for free to a patient, we have no data point to capture that information.
Description of the Dataset Analyzed
+ Drugs priced. We have obtained a total of 52,180 individual negotiated prices, each reflecting a unique combination of hospital-payer-drug. None of the 123 hospitals disclosed prices for all of the 59 oncology drugs we examined, and we presume that each hospital carries a subset. The median hospital has negotiated prices for 23 drugs and, for each drug, we obtained negotiated prices from 55 hospitals (Exhibit 2). As expected, the number of hospitals carrying drugs closely paralleled the breadth of their medical use as suggested by the CMS dashboard. For example, Neulasta is carried by 100 of the 123 hospitals, Velcade by 93, and Alimta by 88. On the lower end of the range, the vast majority of hospitals did not have prices for late-launching biosimilars, e.g., Avsola (only 3 hospitals of the 123), Hizentra (3 hospitals), as well as secondary brands of commonly used products Octagam (IVIG, 5 hospitals) and Belrapzo (bendamustine, 8 hospitals). Here, we report analysis for drugs where we have negotiated price data from at least 10 hospitals.

+ Insurance line. Essentially all hospitals reported commercial insurance and those represented 85% of prices obtained, 65 hospitals reported Medicare advantage plans (10% of price data), Medicaid prices were reported by 30 hospitals and represent 3% of price data, and Medigap/other government prices were reported by 14 hospitals (1% of data). We suspect there has been some confusion about the need to report data from plans managed by commercial payers on behalf of government agencies, and thus the amount of data available for government-owned entities is lower.
Examining Hospital-Reported 340B Drug Prices and Profits
340B DSH Hospitals Charge Insurers 3.8 Times the Costs of Their Drugs
340B hospitals are entitled to a 23.1% ceiling price discount off of the ASP, but the discount can be higher if the drug price is increased above the rate of inflation. Drug companies may provide further discounts to 340B hospitals beyond the ceiling price, which is a common practice in competitive markets. The actual prices paid per drug are undisclosed; however, in 2020, CMS included the results of its 340B drug acquisition cost survey in its annual Hospital Outpatient Prospective Payment System rulemaking, which estimated the average discount at 34.7% off of the ASP.
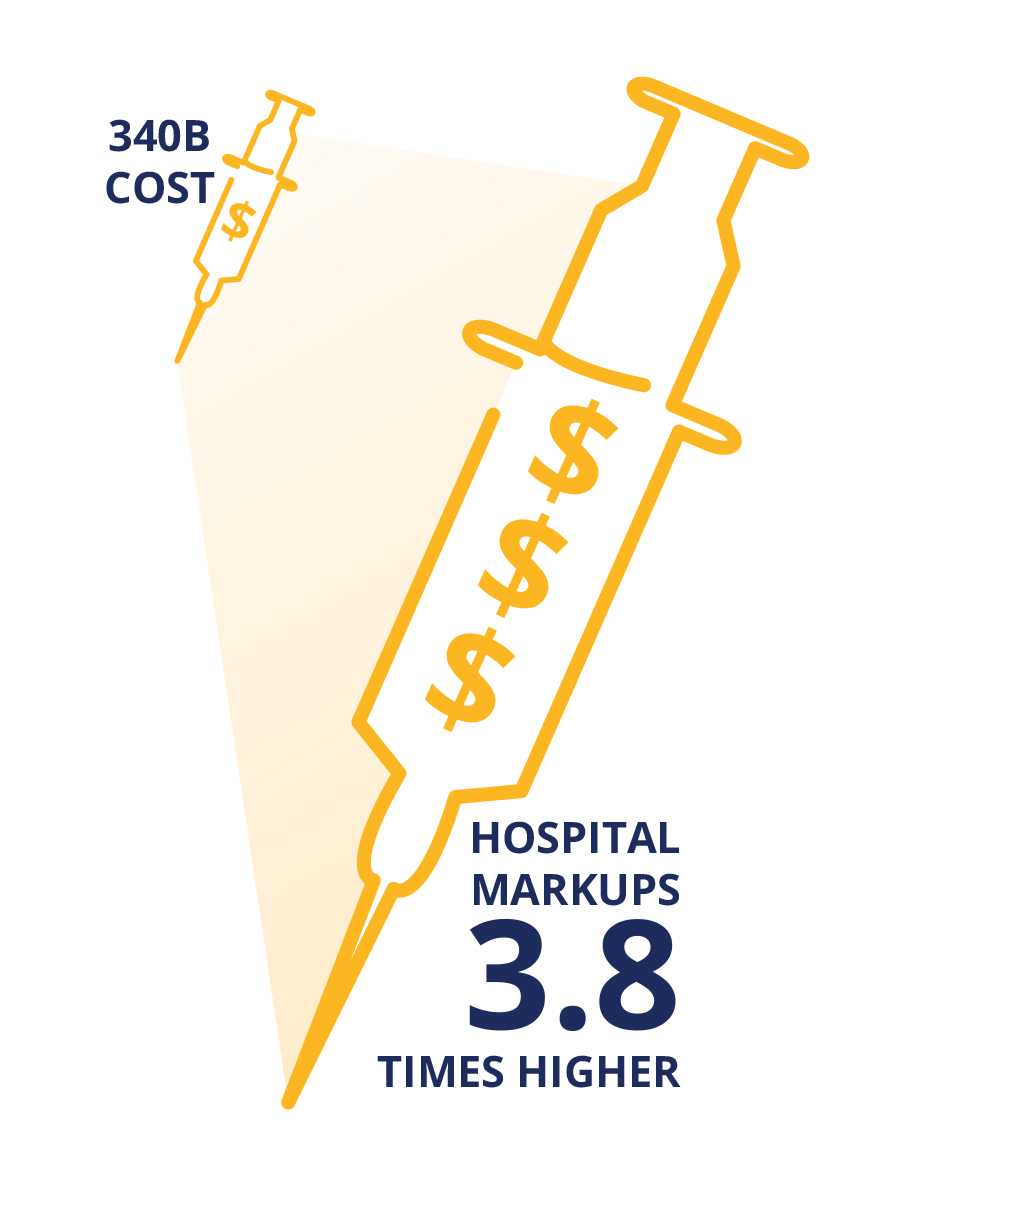
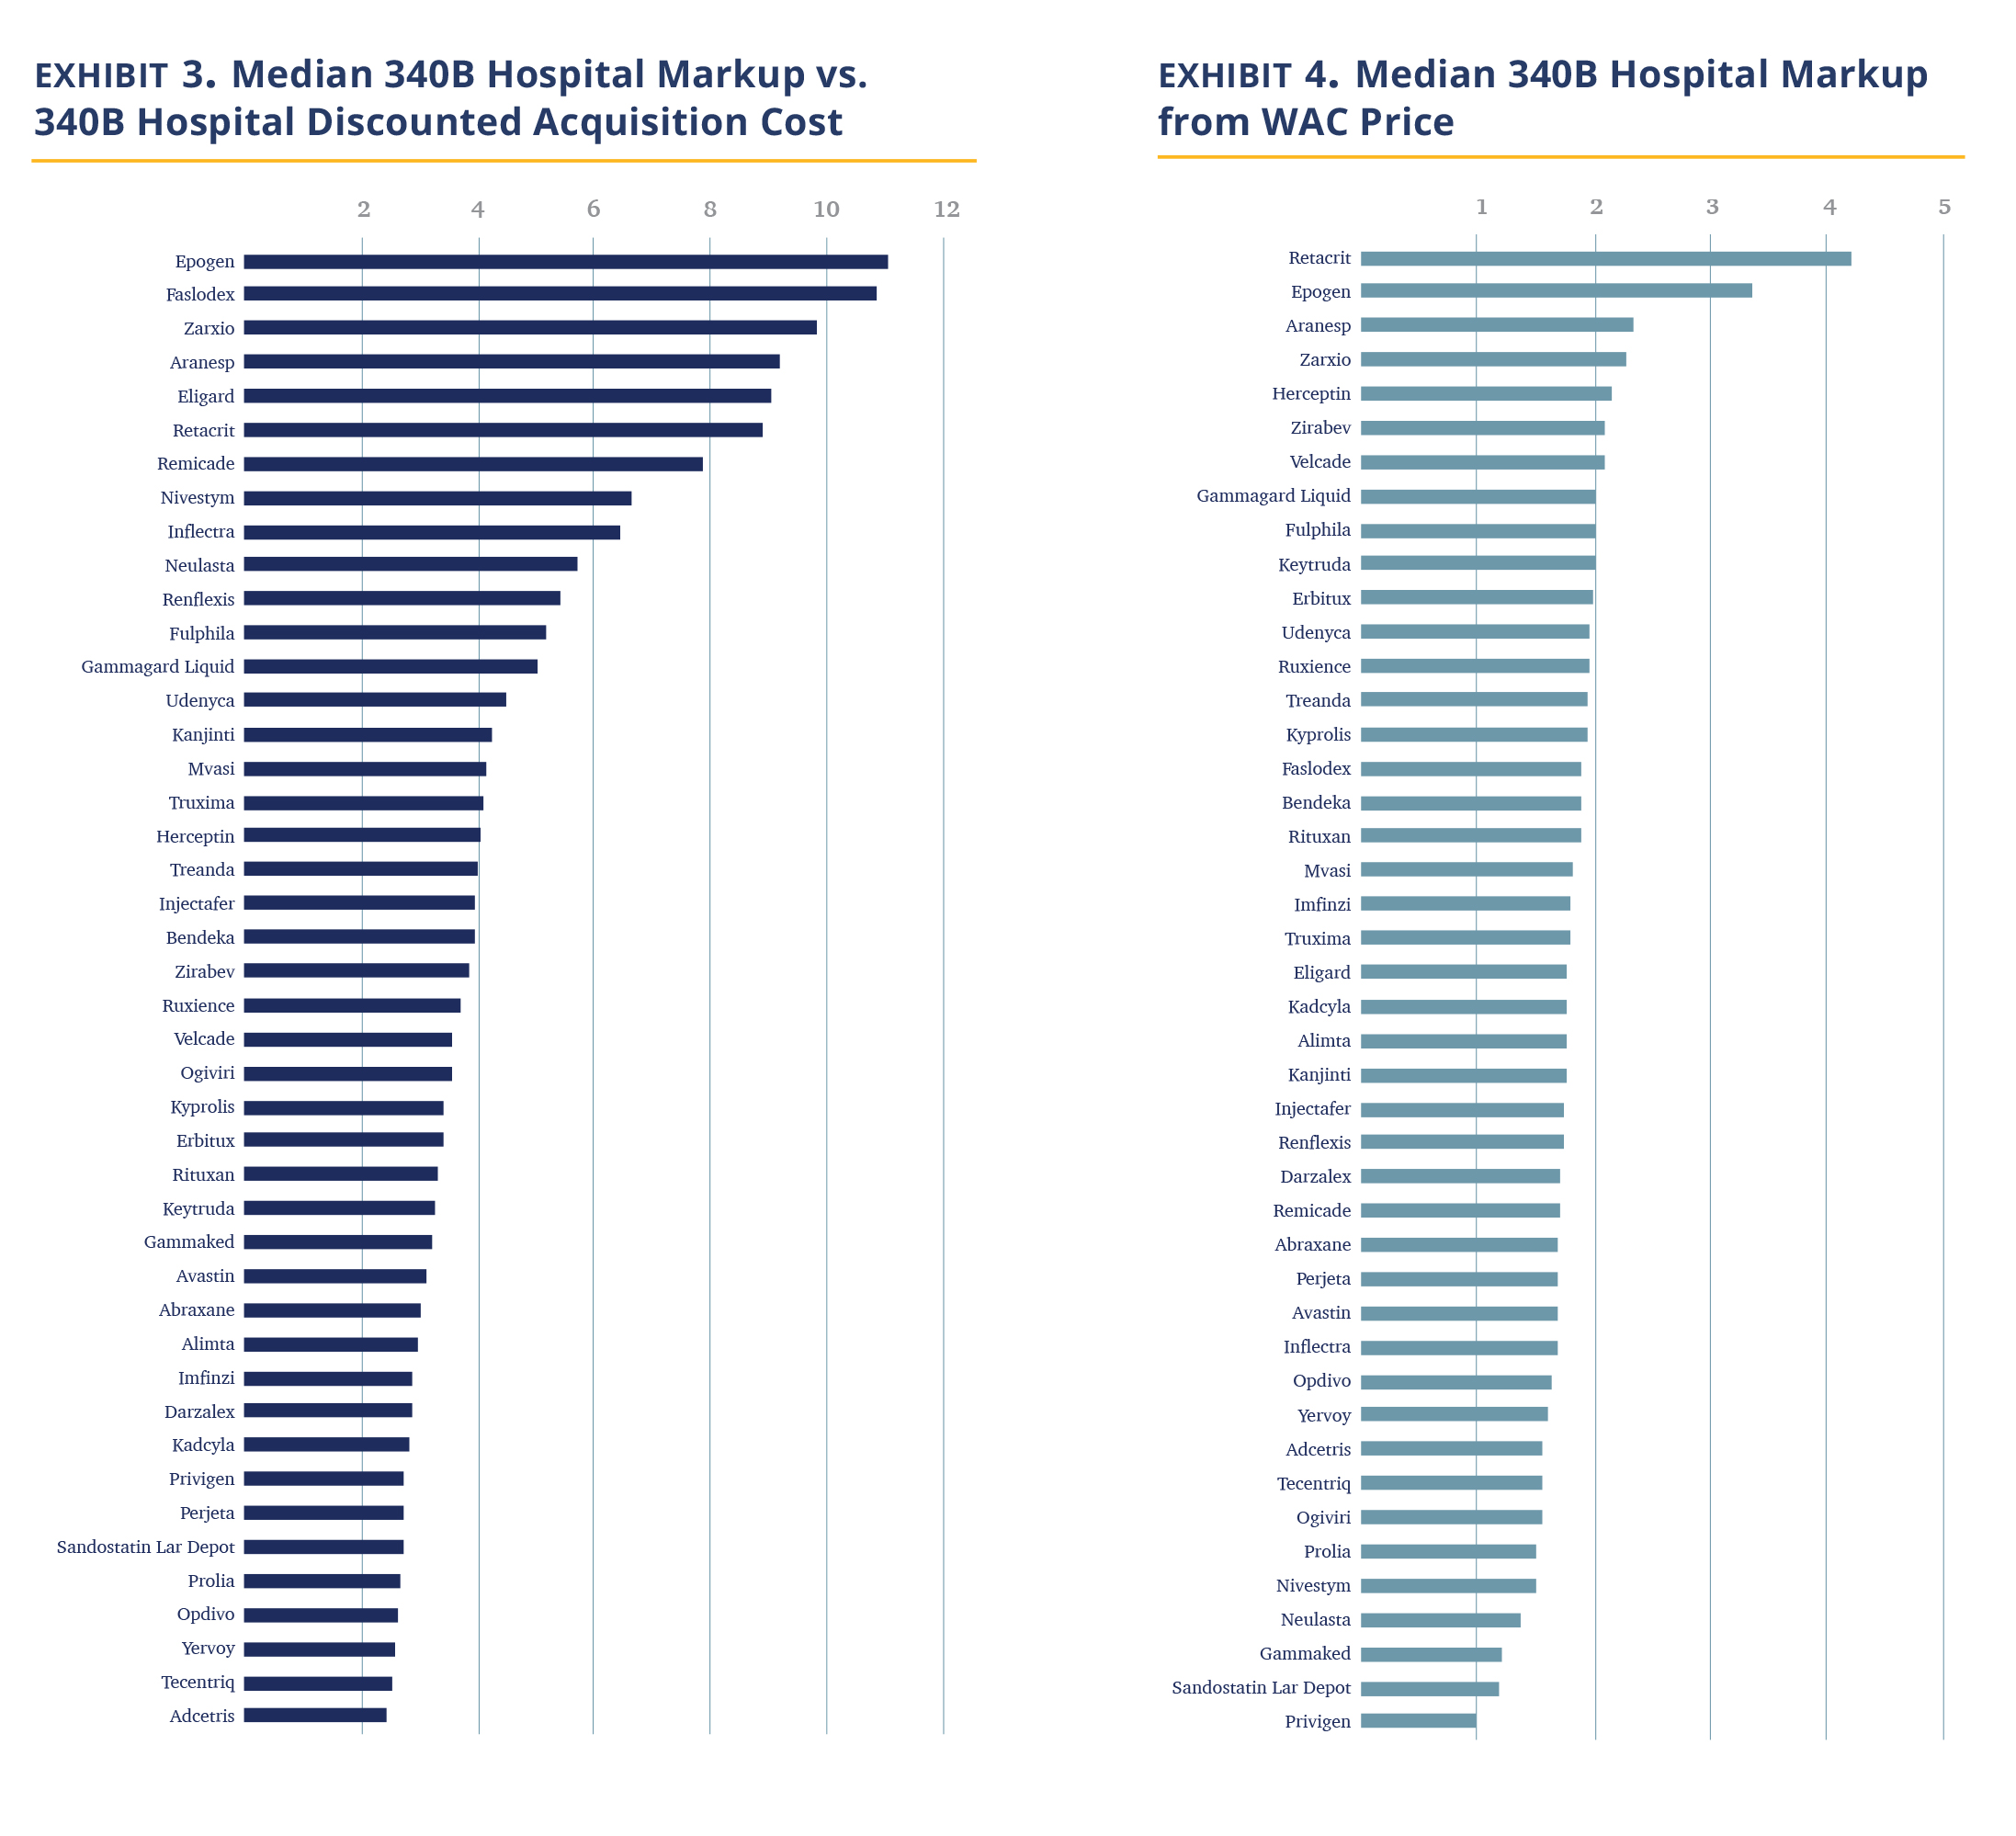
In Exhibit 3, we calculated the median 340B hospital markup by comparing the hospital negotiated prices for insured outpatients to the published 3Q21 ASP, discounted by 34.7%, which is our estimate for the 340B hospital cost of the drug. The data shows 340B hospitals price drugs at 3.8 times their 340B acquisition costs. The increase in price does differ materially by the drug. The lowest median markup was 2.4 times (Adcetris) and the highest was 11.0 times (Epogen).
Examining the data, it immediately becomes apparent that the highest markup is for drugs in competitive markets, mostly biosimilars, and their reference drugs. In these markets, the purchase price hospitals pay are materially discounted vs. their WAC price (i.e., ASP << Wholesale Acquisition Cost (WAC)), while a lower level of markup is observed for drugs where hospitals are not able to obtain material discounts (and thus ASP is only few percent points below the WAC). Examining the relationship between WAC prices and 340B prices, we note a substantial, but more moderate and less variable median markup of ~1.8 times (Exhibit 4).
A few observations fall out of the data.
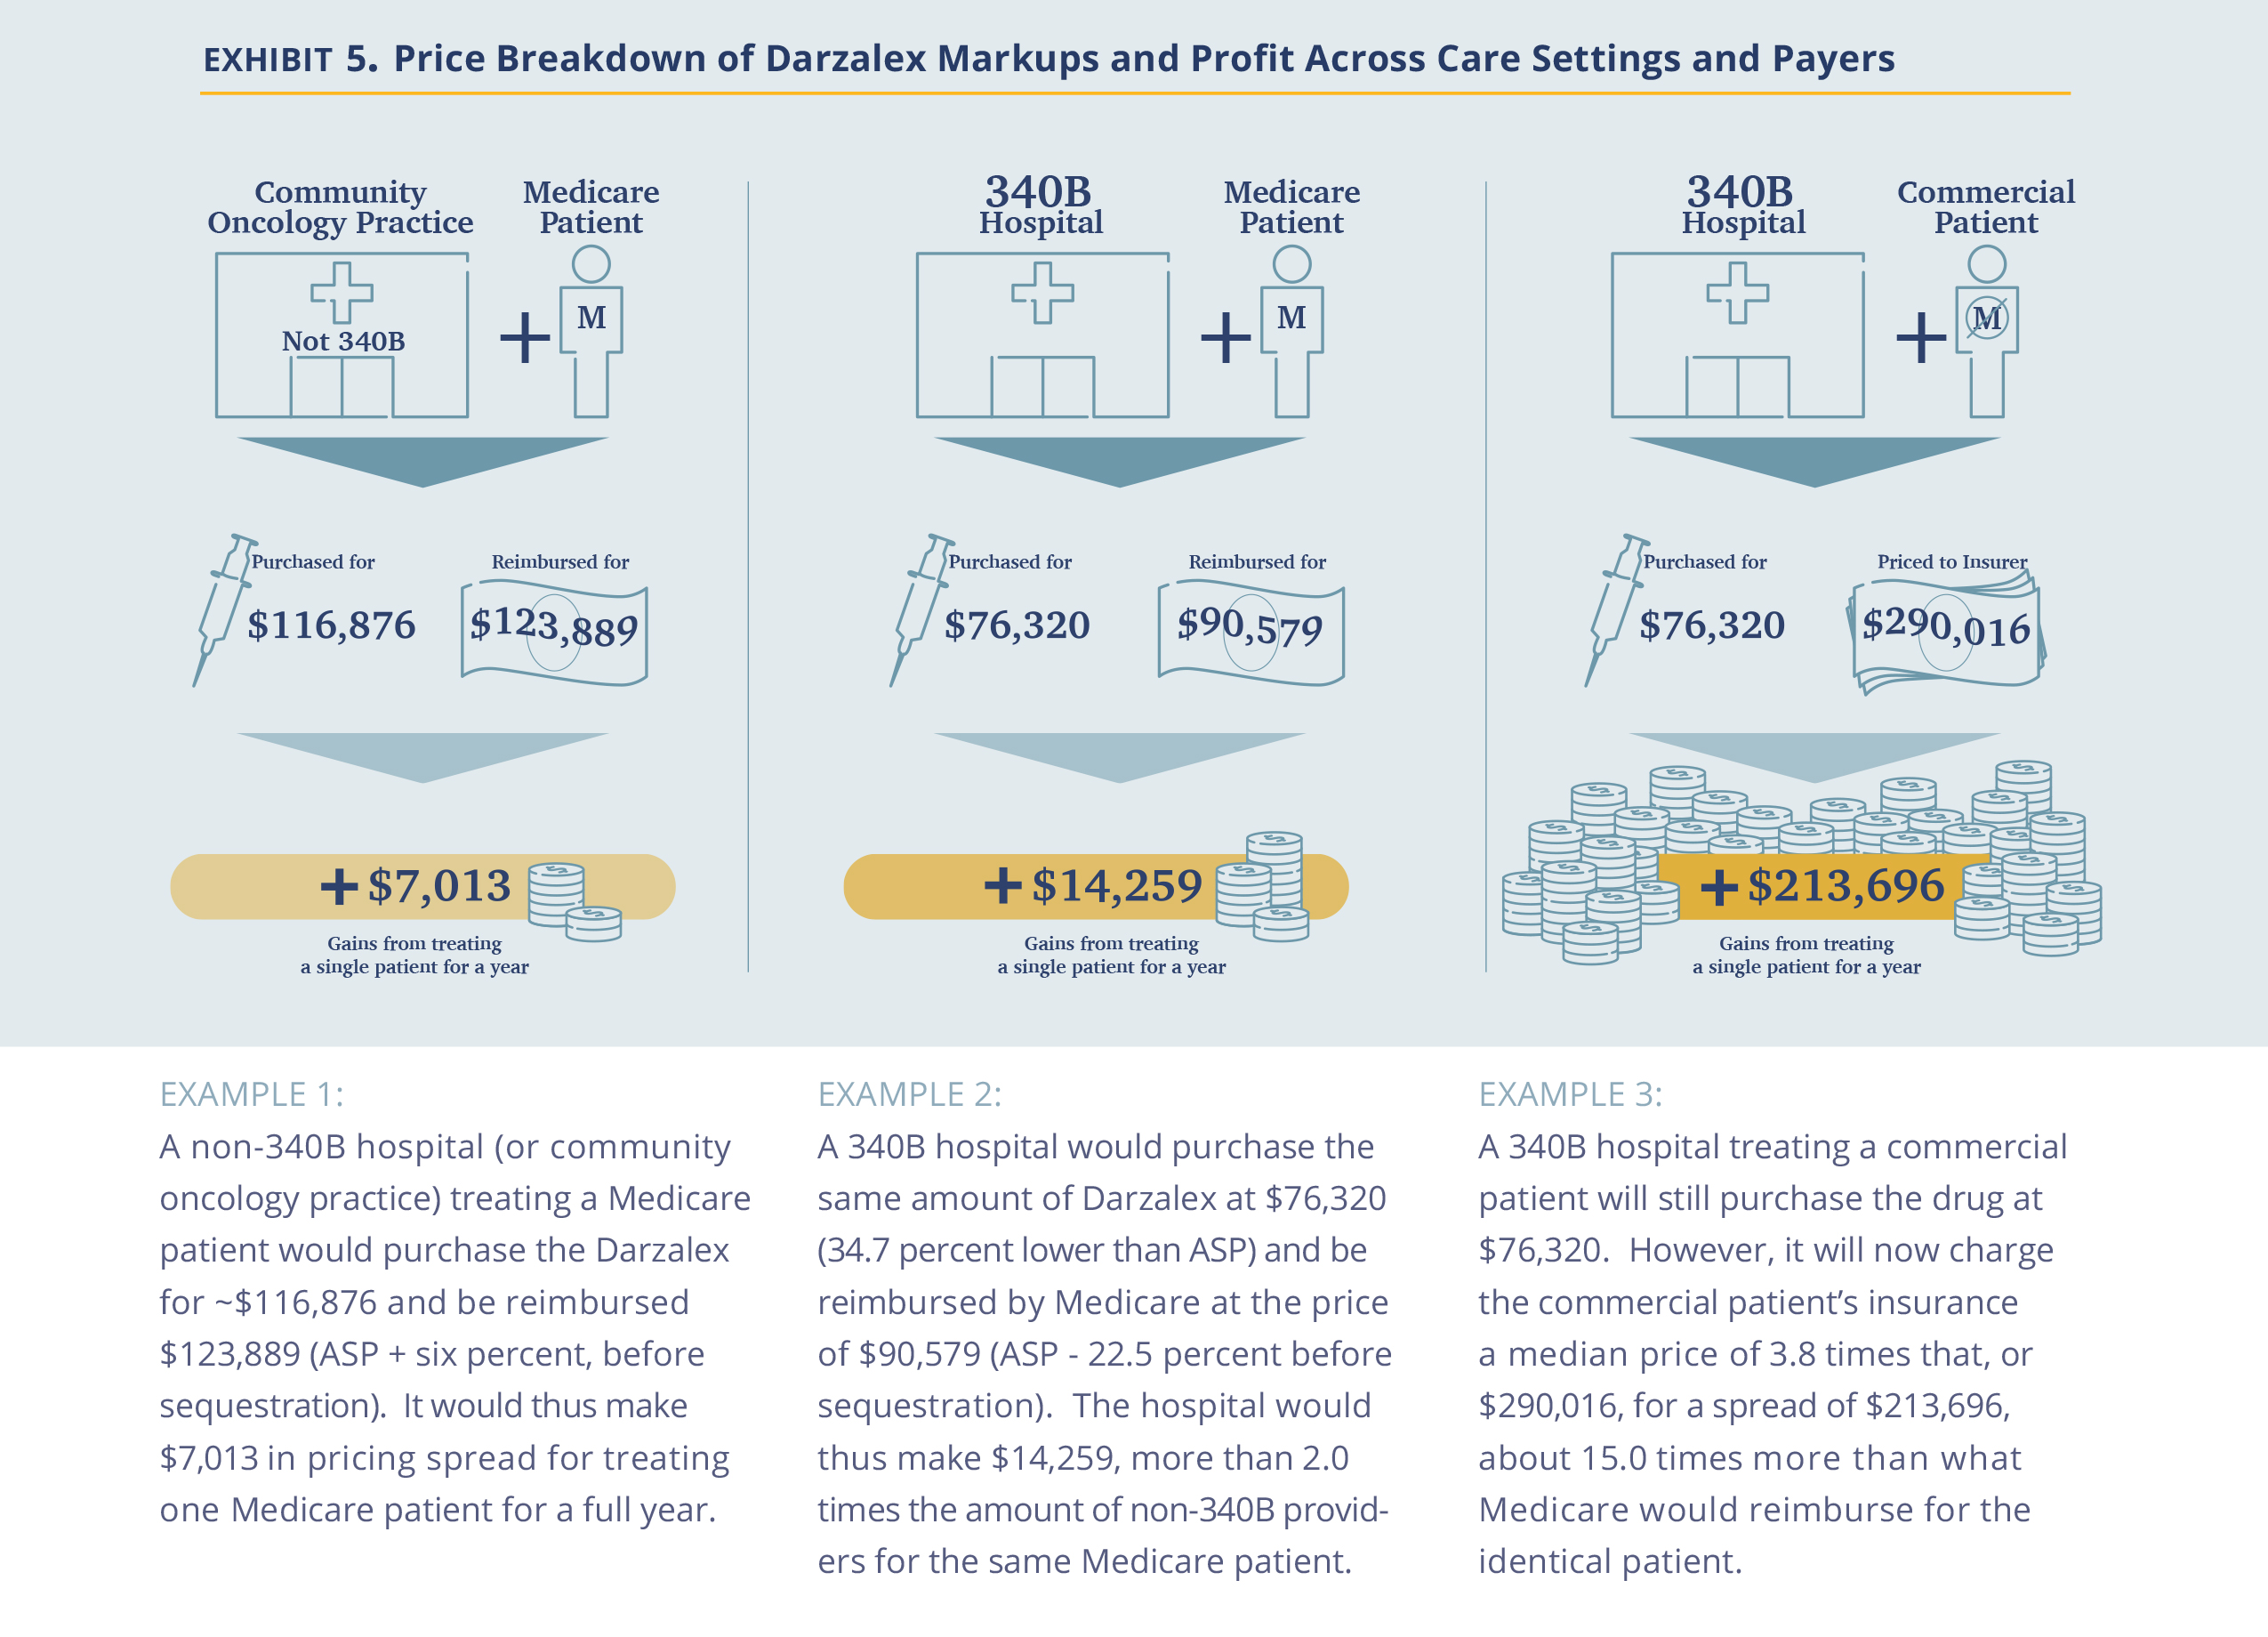
First, 340B hospitals markups are responsible for a significant portion of drug costs realized by the commercial employees. As a reminder, CMS reimburses non-340B hospitals and independent community oncology practices a 6% percent spread between the average cost of the drug (i.e., ASP + 6%), before the agency extracts the 2% sequestration cut. This spread, together with the administration fee, is viewed by CMS as the ‘fair value’ of service of administering the drug. 340B hospitals are reimbursed by CMS at a lower rate of ASP – 22.5% (before sequestration); however, 340B hospitals have a higher drug margin on Medicare patients because the government estimates their purchase price for drugs averages 34.7% of ASP. This alone is a handsome profit from Medicare patients for 340B hospitals. However, unlike CMS, the data show that commercial insurers are charged 3.8 times the acquisition price of oncology drugs to 340B hospitals, making the 340B hospital profit for treating commercial patients with cancer truly remarkable.
An example may be useful here. Darzalex, a Johnson & Johnson manufactured infused drug, is very effective and extensively used in the treatment of multiple myeloma. Treatment with Darzalex often extends beyond a full year of treatment. In its first year of treatment, in a common combination with Revlimid and Dexamethasone, an average-sized patient (75kg, 22.5 cycles) would be administered 27,000 mg of Darzalex.
Second, the analysis suggests that 340B drug discounts are captured by hospitals rather than being passed on. The U.S. has made a significant effort in encouraging drug price reductions through the introduction of biosimilars. These efforts have been successful in forcing prices down at the manufacturer level, as captured by the ongoing reduction in ASP prices. In the non-hospital segment, where commercial prices are also largely based on ASP prices, the discounts are passed on to insurers (and hopefully, employers). However, in the hospital segment (specifically, the 340B hospital segment), the incremental discounts are captured by the hospitals, which do not pass the discounts on to insurers. Thus, we posit that while Congress and other government agencies focus on the reduction of drug prices at the manufacturer level, addressing the costs at the hospital level is equally critical in reducing drug costs for patients, as hospitals account for roughly half of the use of oncology drugs (source)
Third, the pricing dynamics observed is also an extreme example of cross subsidy where commercial employers pay a price several times higher for the same drug as Medicare. Viewed from a hospital profitability perspective, after subtracting the cost of the drug, the difference is even larger. For example, a commercial patient in the Darzalex example above is worth almost 15 times ($213,696 vs. $14,259) more than a Medicare patient for a 340B hospital. It goes beyond the scope of this analysis, but economically, the much higher value of commercial patients could drive 340B hospitals to focus on the healthier/younger commercially-insured population away from the objective of the 340B program to focus on the less fortunate.
Last, the failure on the part of commercial insurers to rein in these drug costs is concerning. Unlike the public, insurers are clearly aware of the differences between what they pay hospitals and what CMS pays. Yet, the gap persists. We discuss the rationale for this below, but here we wanted to plant a seed in the reader’s mind that price transparency at the proximal buyer level may not be enough.
There is a Large Spread in Negotiated Prices Between Hospitals and Between Payers in the Same Hospital.
340B hospitals purchase drugs in a relatively narrow price ‘band’ as they all enjoy the same maximal allowable price and further discounts through the same GPO (Apexus). Thus, the difference in the prices charged between hospitals represent differences in their own pricing choices. One question is whether they all choose roughly the same markup? The answer is no. Comparing negotiated prices between hospitals across drugs show a shallow bell curve (or ‘fat tails’) distribution.
Comparing individual hospitals’ median prices for each drug to the median price across the hospitals, we find 14.3% of drug prices are less than 0.5 times the median price and 13.1% are more than 2.0x the median price across hospitals, (Exhibit 5). Further, prices appear to reflect a choice. Of the 91 hospitals reporting at least 10 individual drug prices, five consistently priced their drugs at 2 times the median and nine consistently priced drugs under 0.5 times the median.
Another intriguing question is the band of pricing within the same hospital to various payers. The observation is that we have a similarly broad band of prices, as well. Using Keytruda as an example and a plethora of hospitals, we show that the typical price band for Keytruda was ~2.4 times with the lower high to low spread being 30% and the highest exceeding 5 times (Exhibit 6).
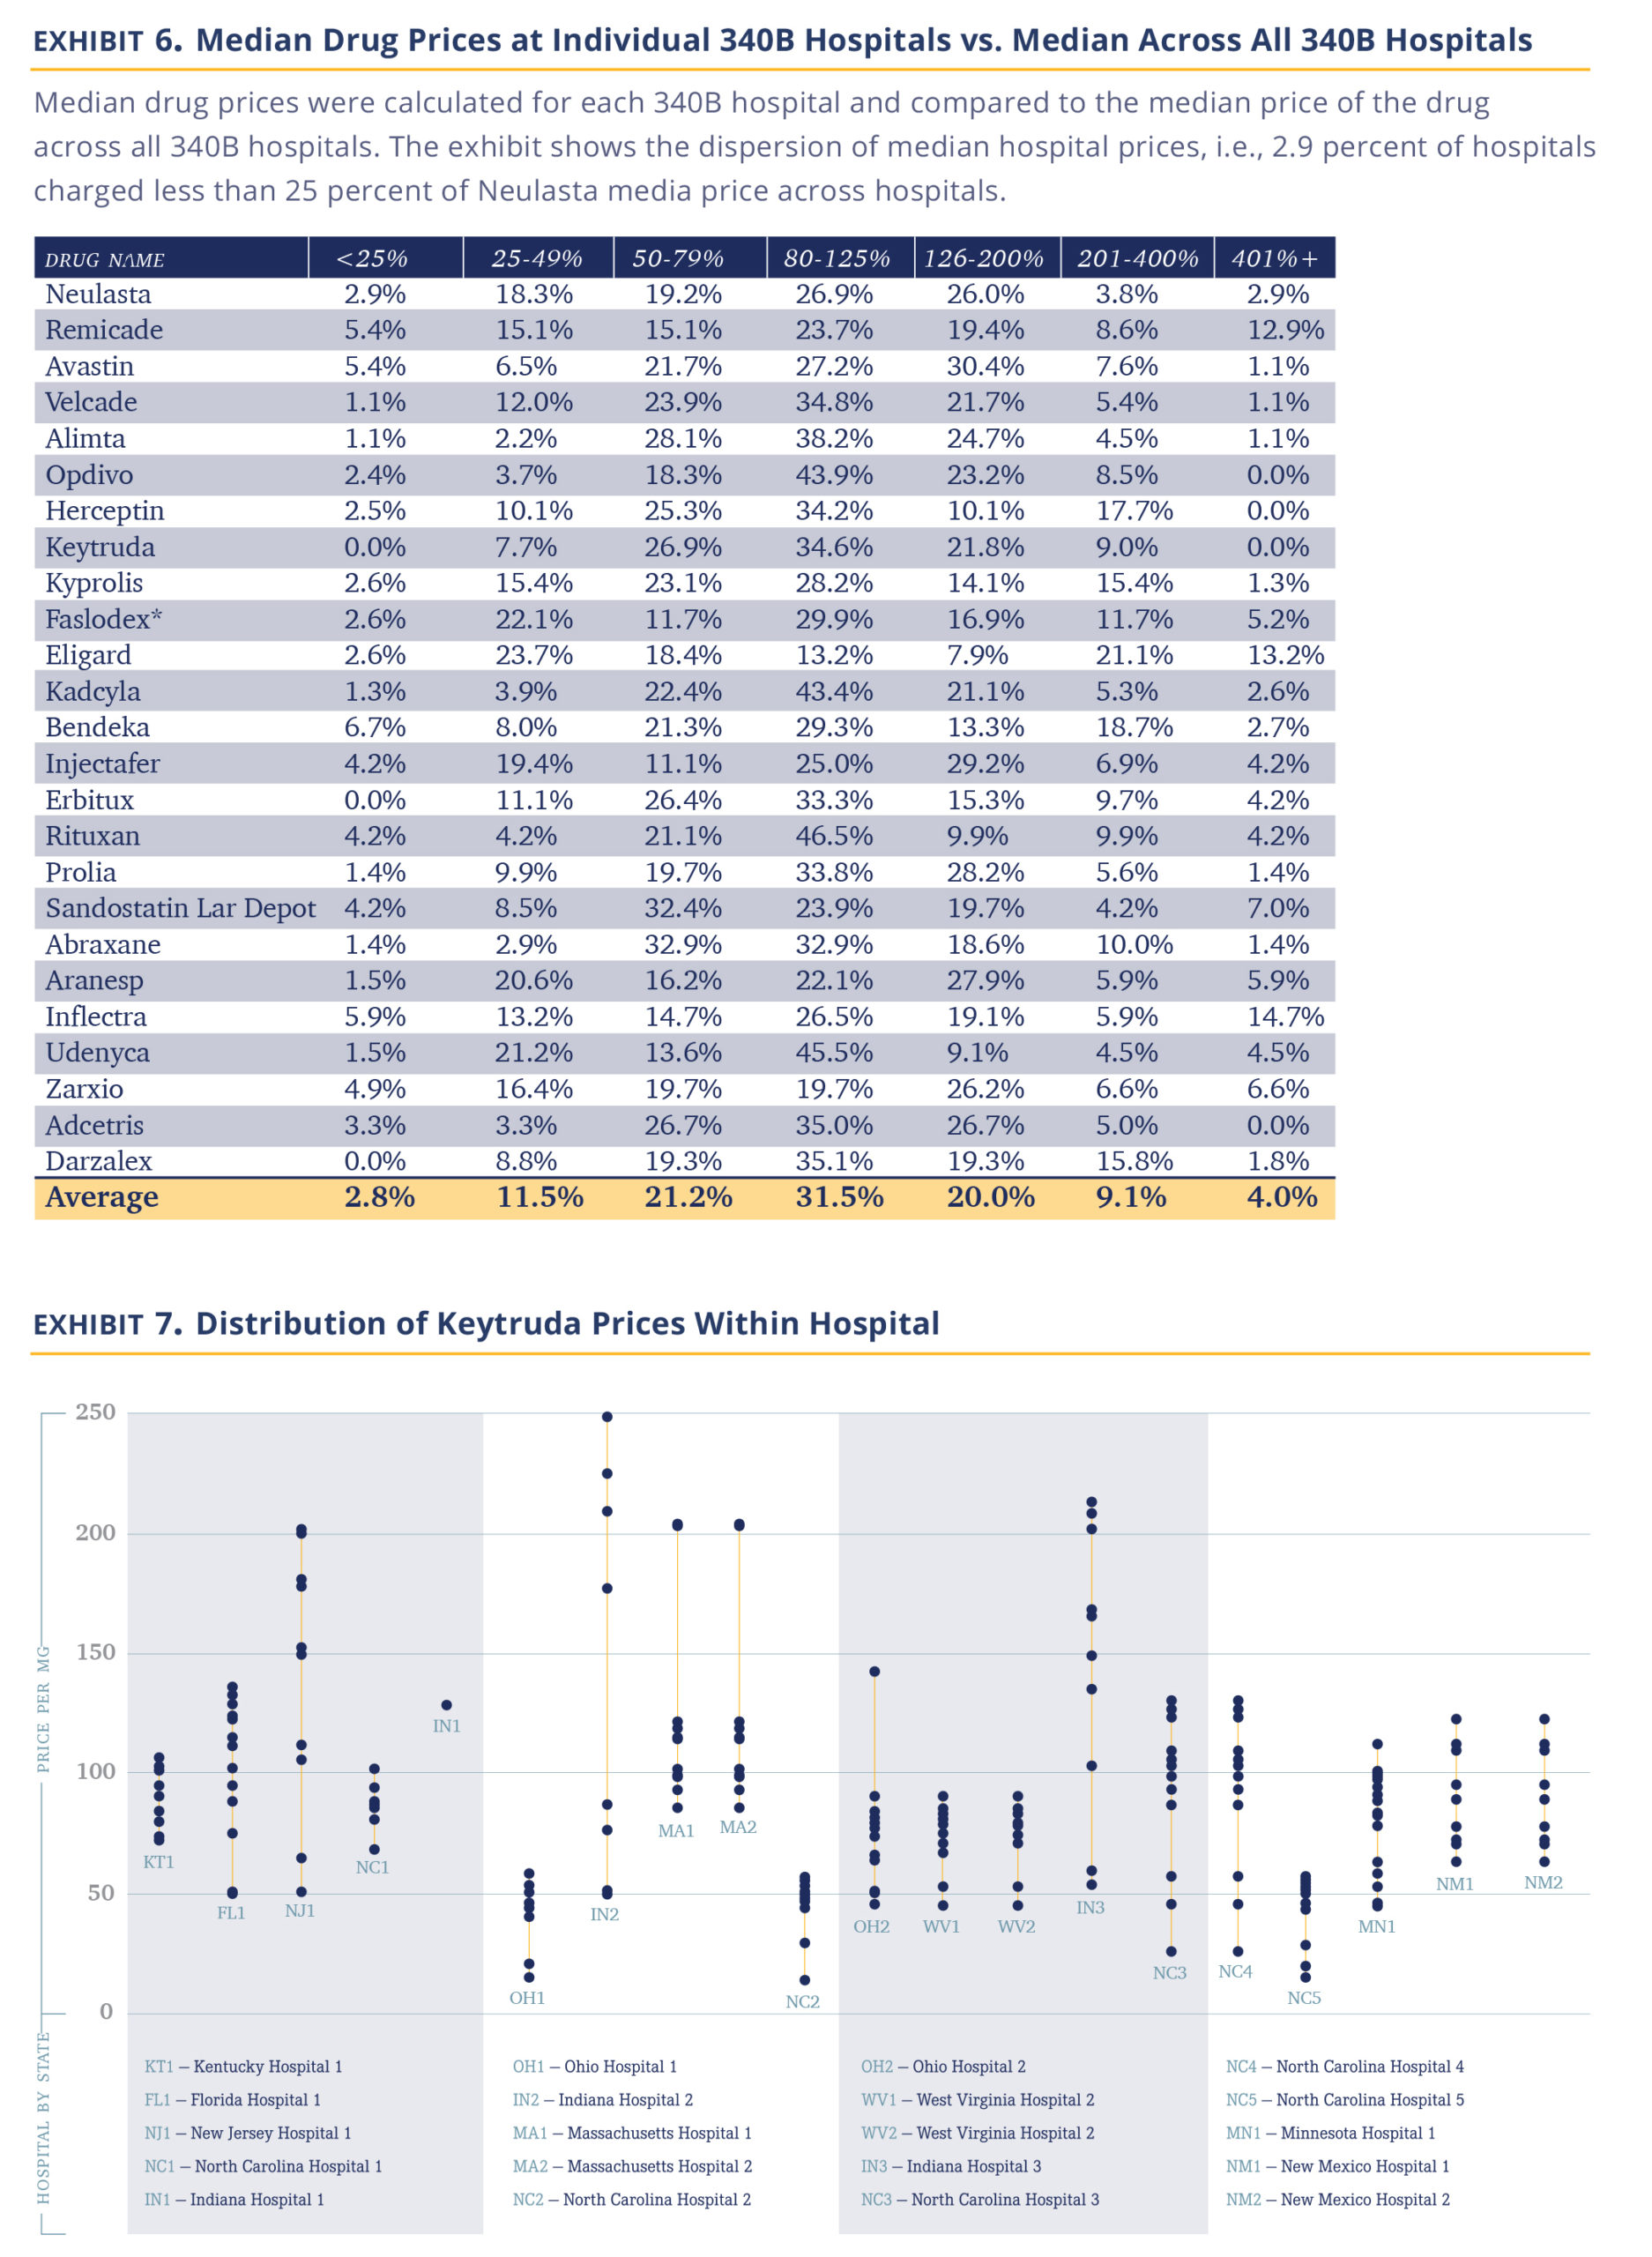
Several important observations fall out of the data. The first being that 340B hospitals appear to be sophisticated pricers who practice a sharp form of price asymmetry, charging very different prices to payers, both across institutions and within the same institution. There are few industries that are able to introduce such differential pricing for the same service (maybe the airline industry). However, it argues against 340B hospitals being disinterested in pricing and just setting a fair price allows them to fulfill their not-for-profit mission.
The transparency within hospitals should allow insurers some negotiation room. Presumably, insurers were not aware of their relative price vs. other insurers within the same hospital. An insurer observing that its prices are high vs. same-size peers in the same hospital would presumably immediately argue against that price. In discussion with insurers, we have become aware that several have internal efforts to do just that.
That said, insurers are intermediaries. Their priority is to ensure their ability to compete vs. other insurers. Thus, while they may be offended by the 340B hospitals’ markups, the main concern of any insurer in negotiating agreements with hospitals is to ensure their payment to a given hospital fairly reflects their book of business with that hospital and thus allows them to compete effectively with other insurers. The availability of data will certainly help insurers further in ensuring they are in the right place in the pecking order, but we are not sure it will materially narrow the very large spread achieved by 340B hospitals.
Hospitals are Slow to Adopt Biosimilars
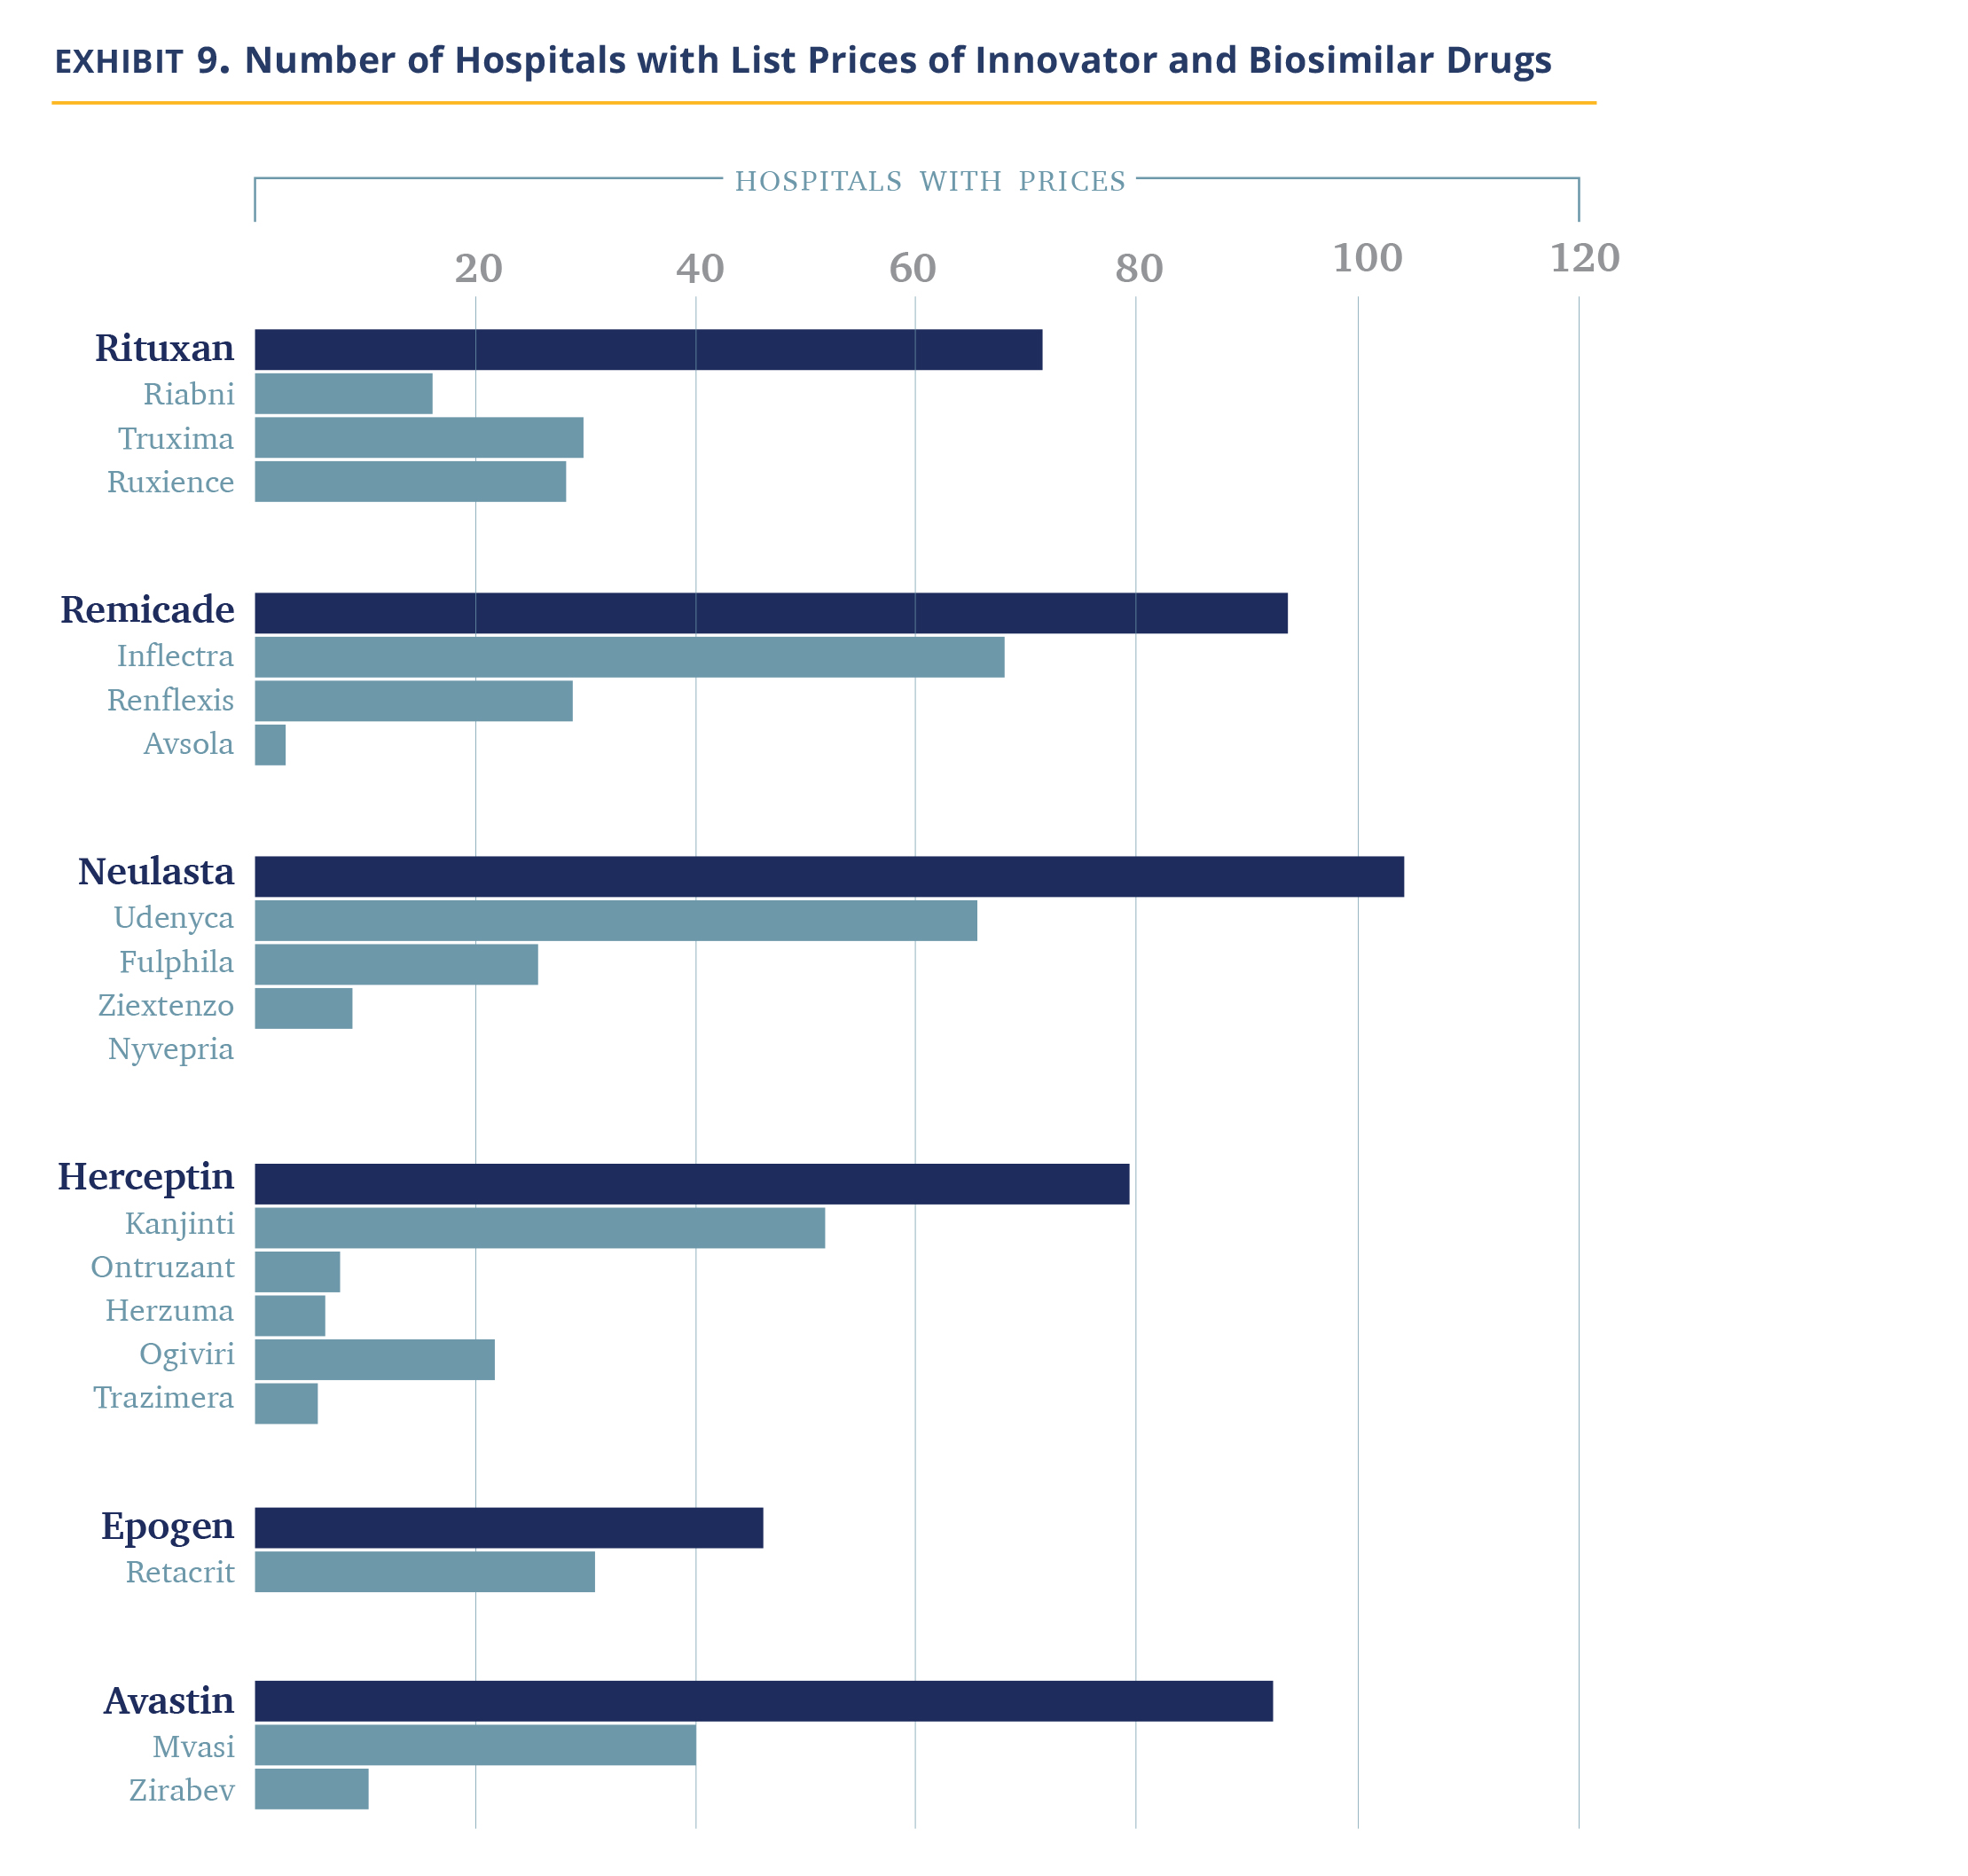
We noted above that 340B hospitals tend to price drugs at markup to their WAC price and retain that price even if manufacturer prices decline. Most biosimilars establish their WAC prices at a discount to the WAC price of the innovator drug (Exhibit 7) as this is needed to compete in the non-hospital segment. However, this does create an economic incentive for 340B hospitals to prefer innovator products because, for the same net-price level, they pocket higher profits.

Our data does not allow us to figure out which product is used more often, but we can observe which products hospitals provide negotiated prices for. Our data shows that hospitals list the branded products more often (Exhibit 8). Between 25% and 56% of hospitals list prices for only the innovator product and essentially none carry all the biosimilars. There are a handful of hospitals/molecules, we note, where only the biosimilars are listed.
Thus, overall, it appears hospitals are slow to adopt biosimilars. However, it is not a uniform observation. Most hospitals follow their economic incentives and use the innovator drugs alone. Others, either because they are required so by insurers, or because they agree with the need to reduce system costs, choose to include biosimilars. In discussions with the pharmacy staff of some 340B hospitals and biosimilar manufacturers, it became apparent to us there are several biosimilar evangelists within the community.
340B Hospitals Do Not Discount Products for Cash Paying or Uninsured Patients
Up to this point, we discussed the overall costs of drugs as charged by hospitals, largely ignoring the difference between direct OOP costs and the cost paid by the insurer (which flows indirectly to the patient in the form of premiums). Now we turn to discuss the price paid by cash-paying or uninsured patients.
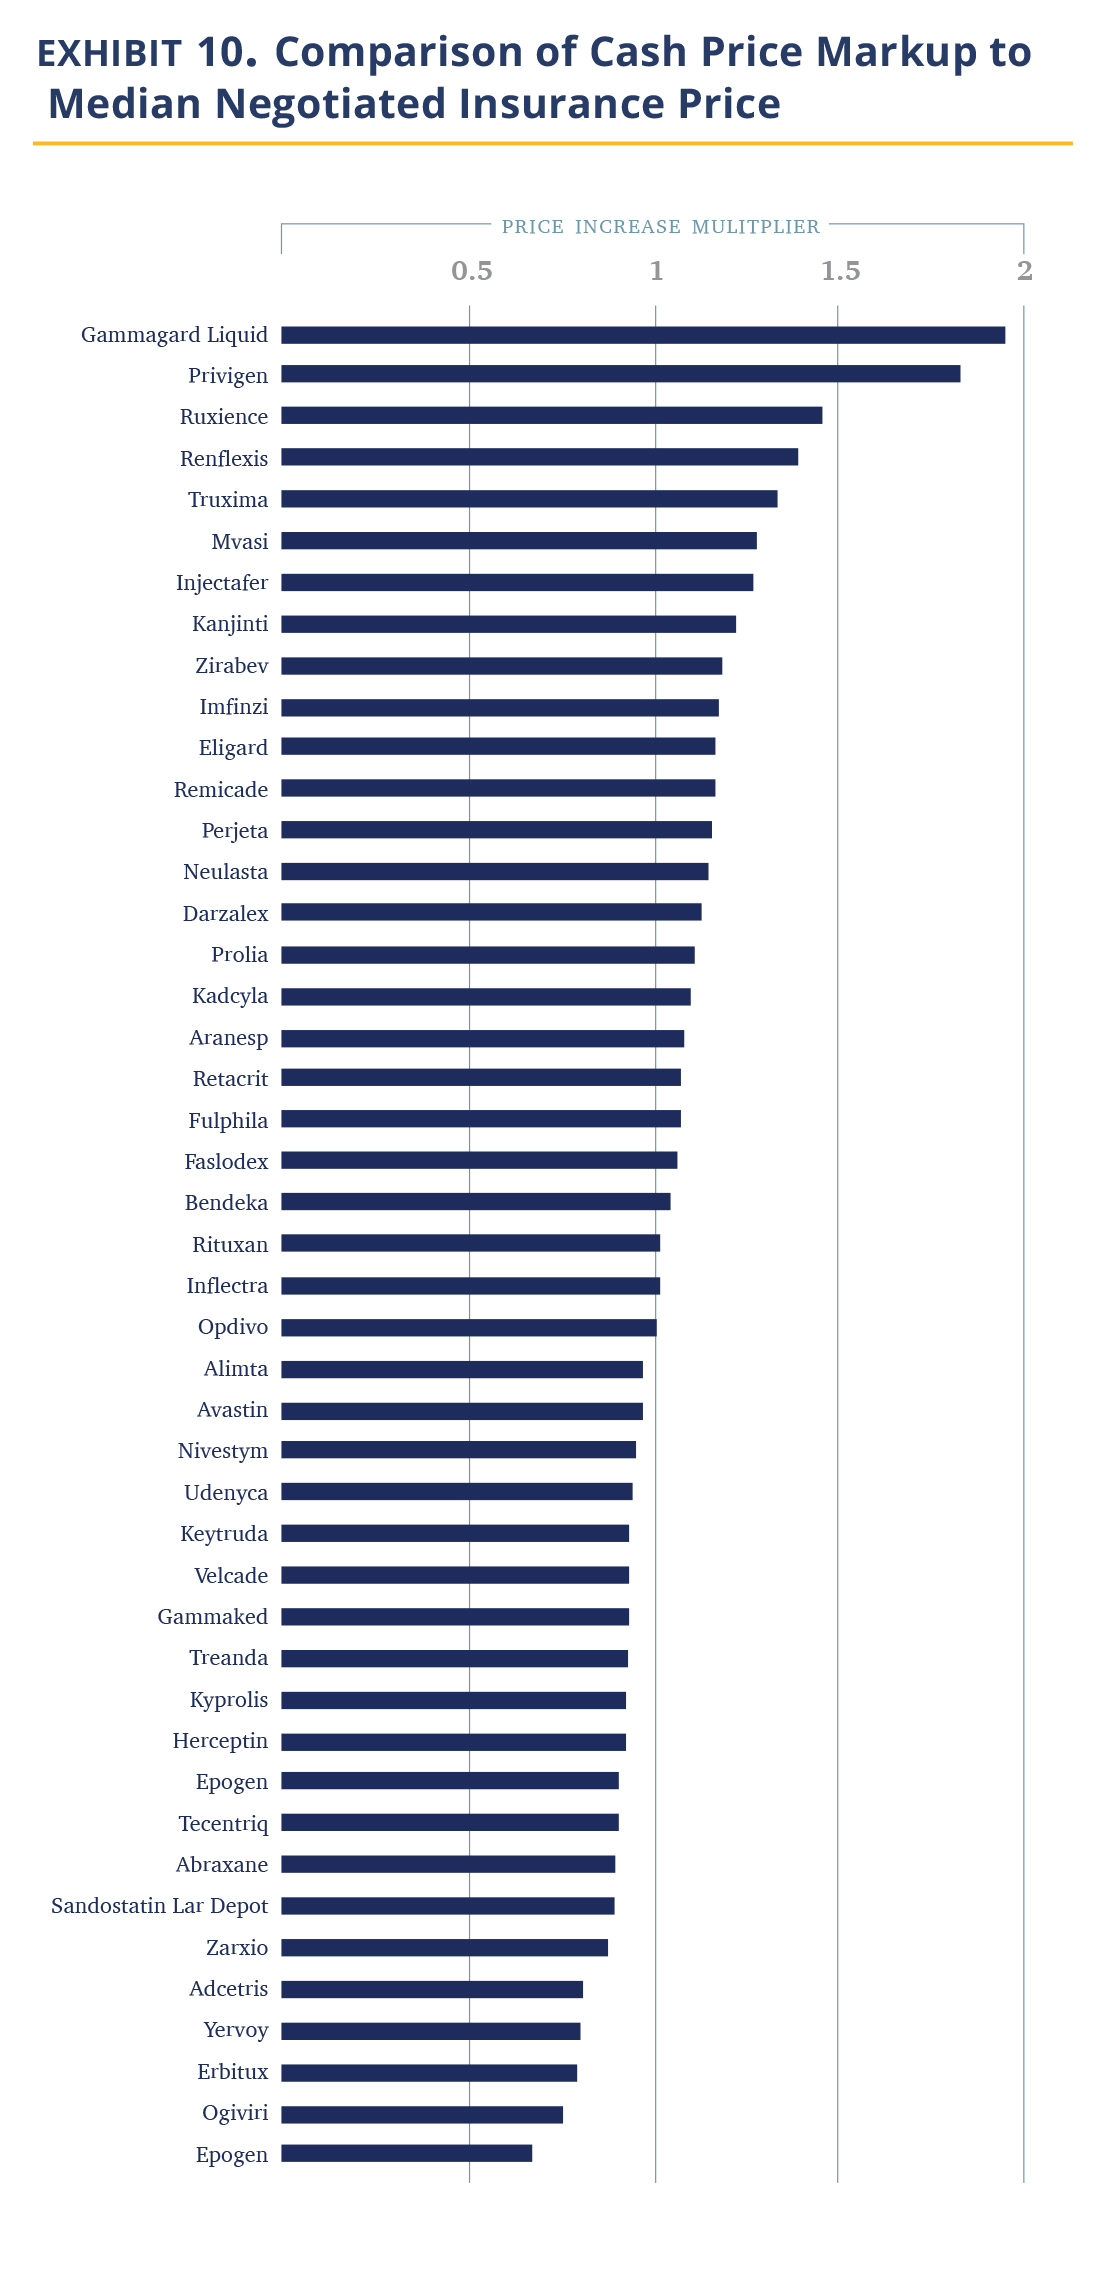
Costs for uninsured patients are easy to obtain as they are explicit reporting requirements by the CMS regulation. In Exhibit 9, we show the relative markup of cash prices vs. the median hospital insurance negotiated price. The data shows that hospitals are charging cash-paying patients roughly the same as the median commercial prices (1.02 times).
This observation is obviously problematic. About 8% of the U.S. population was uninsured in 2019 and the mandate of the 340B designated hospitals certainly includes providing affordable care to this segment. (In fact, 340B institutions’ main response to criticism is that they use the 340B economics to address the uninsured). The idea they charge these patients the same 3.8 times their purchase price does not fit with this mission. We are unaware of a rationale for this pricing approach (these are not the kind of institutions that attract cash-paying affluent international clientele). Recent media publications suggest cash-paying or uninsured patients may be paying more than the insured, with the silver lining that a larger sample employed here suggests that with drugs this is not the median case.
Conclusion and Discussion
The data presented in this report paints a picture of hospitals pricing drugs aggressively.
- The ‘spread’ between the discounted 340B purchase price and the price charged to insurers or patients in 340B hospitals is 3.8 times at the median.
- 340B hospitals are not reducing prices they charge insurers or patients when their acquisition prices decline, negating efforts to reduce prices at the manufacturer level.
- There is pricing inconsistency between hospitals with some pricing drugs 2 times more than the median (i.e., 7.6 times their acquisition price or more) and even within hospitals, charges usually vary dramatically.
- 340 B hospitals are slow to adopt biosimilars.
- Most problematically, 340B hospitals cash-paying customers the same as the median price of insurers, i.e., 3.8 times their acquisition costs to patients paying cash. In short, to the extent 340B institutions fulfill their mission of providing lower cost care, we are not seeing it reflected in their drug prices.
An intriguing question is, why have insurers not acted to reduce drug prices? As we noted above, insurers were aware of the gap between the price they pay and what CMS pays. They also had some aggregated pricing data (which benefit consultants sell to them). We have heard four hypotheses for this observation. First, the balance in the negotiating position is often not on the insurers’ side. While the largest insurer in a given geography may be in a position to negotiate better prices, more moderate size insurers do not and merely accept the hospital price. Second, insurers have largely not focused on drug costs both for organizational reasons (hospital costs are administered separately and locally, while drug costs are managed nationally via the pharmacy benefit manager (PBM)) and, because until recently, outpatient drugs were not a big cost center, although they have been growing quickly as the Medicare Part B cost trend suggests. Third, insurers are focusing on shifting drug usage to non-hospital settings (either community clinics or specialty pharmacies) rather than attempting to negotiate prices with hospitals. Last, and least charitable, insurers are intermediaries. As long as they do not pay more than their peers and costs rise at a moderate enough rate to cause disruption of the system, insurer interests lie elsewhere.
Thus, the importance of pricing transparency is beyond the insurance layer. It is evident from the current situation that the drug price situation in 340B hospitals is problematic and relying on the current market structure to curb costs has not been effective. Making drug prices visible to a broader cohort of stakeholders – primarily employers but also regulators and the public will create some pressure on hospitals to control their prices, notably those seeking advantages from the public purse. The recently published executive order instructs the HHS Secretary to further enhance hospital price transparency data. We applaud this direction and have suggested some ideas where to focus in the earlier part of this report.
Will transparency be enough? We are uncertain. The health care system has proven resistant to change across multiple dimensions (electronic records, patient-generic settlements, etc.) and the arguments in favor of 340B institutions are well known. It usually requires legislative or regulatory changes modifying the ‘rules of the road’ to get a change to take place. One may be needed here to effectuate change.
Examining Hospital Price Transparency, Drug Profits, and the 340B Program 2021
Introduction
The United States spends 17.7% of its GDP on health care related expenditures, far above its developed market peers, who generally spend no more than 12% of their GDP. This excess health care spending added costs are an enormous burden on the U.S. economy and ‘crowd out’ important necessary spending on areas such as infrastructure, education, and social programs. It is broadly recognized that much of these costs are the result of inefficiencies in the U.S. system.
One of the fundamental tools suggested to understanding and addressing excess spending in the U.S. health care system is pricing transparency, as better visibility and understanding of costs will ostensibly drive organizations and individuals to make more cost-aware health care decisions, leading to a decline in the use of overpriced goods and services.
To help improve the shift towards greater health care transparency, the Community Oncology Alliance (COA) commissioned analytics and consultancy firm Moto Bioadvisors to examine compliance with, and insights from, recent hospital price transparency data, with a particular emphasis on oncology and the 340B Drug Payment Program.
Assessing Hospital Compliance with the Centers for Medicare & Medicaid Services (CMS) Transparency Regulations
The regulation enacted to drive hospital price transparency. Hospital spending represents 31% of national health care spending and is the largest area of health spending in the U.S. (source). The historical lack of transparency in U.S. hospital prices has been suggested to be an important driver of higher U.S. hospital prices. As part of the Affordable Care Act (ACA), Congress enacted section 2718(e) of the Public Health Service Act, which requires hospitals to “make public (in accordance with guidelines developed by the Secretary of the Department of Health and Human Services (HHS)) a list of the hospital’s standard charges for items and services provided by the hospital.” CMS initially required hospitals to only make their list prices available (the ‘chargemaster’) but, realizing the chargemaster is ineffective in providing buyers and consumers with effective transparency, CMS revised its guidance in November 2019.
The finalized CMS hospital price transparency regulation requires, among other items, that hospitals publish a “machine-readable” file containing prices for all “items and services” provided by the hospital to patients for which the hospital has established a standard charge. These published prices must include (i) the chargemaster price, as in prior regulation, (ii) price for cash paying customers, (iii) de-identified minimum and maximum negotiated prices and, critically, (iv) payer-specific negotiated charges, which is the rate that a hospital has negotiated with each third-party payer.
The hospital industry has heavily lobbied against the regulation during its notice and comment period and the American Hospital Association (AHA) challenged the rule in court, arguing the law only mandates the publication of chargemaster prices. However, the court ruled for CMS and the new regulation went into effect on January 1, 2021. Post the regulation coming into effect, the AHA continued to argue for its cancellation and leniency in enforcement. We note the regulation also contains a specified civil penalty for non-compliance of up to $300 per day ($109,500 annually) – an insignificant amount for most U.S. hospitals. As discussed in this report, compliance with the law is quite poor. More recently, CMS has noted plans to significantly increase these penalties which may assist in improving compliance.
340B hospitals as focus of transparency interest. The 340B Drug Pricing Program was created in 1992 “to enable [covered] entities to stretch scarce Federal resources as far as possible, reaching more eligible patients and providing more comprehensive services” although a more precise definition of the program objective is lacking. The program requires drug manufacturers to provide qualifying institutions with discounts on their purchasing of outpatient drugs according to a formula prescribed in the law as a condition for participation in the Medicaid program. Essentially all drug companies opted in. While estimates vary, the minimal 340B discount is 23.1 % and a recent CMS study found the average discount is 34.7% vs. the prevailing U.S. commercial price, known as Average Sales Price or ASP (source).
The eligibility criteria for qualifying 340B institutions have been expanded several times. The largest group or participating entities in the 340B program have become disproportionate share hospitals (DSH). They represent 40% of U.S. hospitals and were responsible for 78% of drugs purchased under the 340B program in 2015 (source). Per recent disclosure, the value of the drugs purchased under the program was estimated at ~$38B (source), and given the drugs purchased are discounted, it reasonably accounts for a share of the U.S. drug market in the low teens, by volume.
The program has been the subject of much debate, with critics pointing to several major deficiencies:
- Lack of supervision and accountability for such a large program.
- Aggressive efforts by hospitals to leverage their 340B status, e.g., by directing patients using high-profit drugs to 340B eligible units, use of satellite offices to increase the reach of 340B units, and use of contract pharmacies to distribute drugs.
- The discounts are applied to the institution, not the patient in financial need. Thus, low-income patients treated outside 340B hospitals do not benefit from the discounts and 340B hospitals obtain discounts on drugs even when treating fully insured patients and obtaining negotiated rates.
- Community physicians have noted the institution-wide 340B discount is putting them at a competitive disadvantage.
The availability of transparent hospital prices offers an opportunity to make the debate on 340B hospitals more informed, using actual data on the negotiated prices hospitals charge insurers and patients for the drugs they acquire at discounted prices under the 340B program. While there is no requirement for 340B institutions to pass along the discounts they obtain (they may use their obtained discounts to fund operations or programs that benefit the community), it is certainly logical for them to do so. At the very least, one would expect a reasonable markup that allows the hospital to retain some of the profits for other programs, but also serves the (presumably lower income) local community interest in (i) obtaining lower cost insurance, as rates are dependent on local medical expenses, including drugs; (ii) paying less out-of-pocket (OOP), as OOP costs are often derived as a percentage of the negotiated hospital rates; and (iii) for those who need to pay cash, obtain their drugs at an affordable rate. In this analysis, we use 340B hospital data obtained as a result of the CMS transparency rule above to try to add to these debates.
What We Did: Methodology and Data Challenges
We have selected a list of 59 oncology treatment and supportive drugs to study (see Appendix). The drugs were selected primarily based on being the highest dollar expenditure for Medicare Part B drugs in 2019 (link) augmented with lower expenditure drugs sharing the same active ingredient, either generic or biosimilar. (For example, Ontruzant was included to complete the list of the trastuzumab family of drugs).
We then obtained a list of 1,087 acute care 340B DSH hospitals. In April 2021, we searched each of the hospital websites for the price transparency file, finding that 890 had published such a file on their website, with 876 files available for public access. We then analyzed the data to ascertain if it attempts to comply with the new (January 1, 2021) HHS hospital transparency regulation, or instead only provides chargemaster data required by the pre-2021 regulation. If any price data relevant to the new regulation was found in the data file (e.g., minimum price, cash price), we considered it ‘attempting to comply.’ Only 327 of the hospitals in the 340B program attempted to comply with the new transparency regulation.
We then searched each hospital file that attempted to comply with the new regulation for inclusion of drugs, considering the possibility that some hospitals do not include drugs either because they are organizationally managed separately or, being aware of the controversy of drug markups and 340B drug discounts, chose to eliminate them. If the file mentioned either of the three largest oncology drugs (Keytruda, Rituxan, and Neulasta) either by brand, generic name, or Healthcare Common Procedure Coding (HCPCS) code (J code), they were considered to include drugs. Of the 1,087 340B hospitals, there were 233 hospitals that included drug prices. Last, as we began to process the files, we realized some had not included individual negotiated payer data required by the new transparency law, but rather only, cash price, minimum, maximum, and chargemaster prices.

Analyzing the 123 hospitals, we observed that the majority of them did not provide well-organized and easy-to-read datasets; instead, they seemed to be snapshots from internal billing systems. They included additional data unrelated to prices, multiple entries for the same products, and cost modifiers. The coding was inconsistent (e.g., some products were coded in different lines under their branded and generic names) and codes often reflected internal nomenclature. In some cases, hospitals coded missing data using their own convention (e.g., $.001 meant N/A). Further, the drug amount associated with the negotiated price was often unclear (e.g., 1mg or 1 vial containing 6 mg). As our objective was to create a standardized price dataset across all hospitals, we spent substantial time developing methodology to standardize the data. We removed unreasonable data points (such as charging $0.01) and addressed ‘duplicates,’ such as different dosages. The resulting database is thus impacted by our judgement and contains 52,180 data points across the 123 hospitals. We note our task was simplified by drugs being a rather uniform product with relatively clear nomenclature and standard dose. We suspect others attempting to develop similar databases for more complex hospital services are facing a much more challenging task.
Suggestions to Improve the Hospital Price Transparency Reporting Data
President Biden’s executive order issued July 9, 2021 instructs the HHS Secretary to “support existing price transparency initiatives for hospitals”(link). As we have recently analyzed the data, we offer few suggestions to help with this effort. The best solution, in our view, is for CMS to create a database that it will own and manage. Hospitals, rather than publishing their own files, would upload the data to the CMS database based on provided HCSPCS code and unit size. We believe this will create a clean and consistent dataset and make it easy to aggregate and analyze the data and save substantial system costs, as individual hospitals will not need to create their own databases.
To the extent this solution is not accepted, and hospitals continue to publish their own pricing databases, we suggest CMS amend its requirement as follows:
- Central data location. Rather than posting files only on their website, hospitals should also upload the file into a central repository created by CMS where it can be accessed (analogous to standard shared-drive website). This would require minimal effort by the hospitals and ensure easy access to the files.
- Data qualification process. CMS reviews the data for minimal compliance with the regulation. A file must be readable with a standard format and contain required minimal data (names of services, individual payers). Data is certified as compliant as of the given date. Our experience is that such review requires ~30 minutes per file (or one FTE for the ~3,000 acute care U.S. hospitals). This would encourage compliance and create clarity for hospitals that provide the data and those that do not.
- Only report negotiated price data. Move the hospital data from a database ‘dump’ to a price database – no other data, such as amounts billed to the payer or price modifier, are to be included.
- Deepen data standardization. The clearest benefit here would be a requirement to report products/services with their HCPCS codes and HCPCS unit size. Product description should have a unique and single cell used per data attribute (we often ran into a single cell describing the product, amount, health plan, and site of care). We would also argue hospitals should use standard nomenclature to indicate inpatient/outpatient use and line of service (commercial, Medicare).
- Require specific data schema. The current regulation defines which information ought to be published but does not specify the X-Y organization, order of data presentation, headers, terminology, and naming convention. It makes it virtually impossible to aggregate the data from different hospitals and compare without material manual adjustments. We suggest that CMS should require a specific data schema for all hospitals to comply with in order to be in compliance with the regulation.
While the modifications suggested above will be very helpful for industry companies attempting to achieve a measure of price transparency into hospital prices, it is absolutely essential for patients attempting to compare prices across several institutions. As presented today, a patient with co-insurance paying a percentage of oncology care costs would categorically not be able to obtain and compare the cost of oncology drugs across local hospitals to their specific health plan (and as we discuss below, the difference between institutions is very material). This view was echoed by others who have attempted to evaluate the data.
Last, a word about the limitation of the dataset. The first and most critical is that we are limited by the quality of the data the hospitals provided. We attempted to ensure the data correctly reflect specific hospital negotiated prices, but presumably errors slipped in given the complexity discussed above. We thus believe the data is best viewed on an aggregate basis, rather than focusing on individual hospital-drug-plans. We specifically avoided outlier data by using primarily median values. We believe the error rate in our data is low enough for median values to fairly reflect 340B hospital’s negotiated prices. The second is that this is price data. We do not have the volumes transacted at each price. Thus, to the extent a hospital transacts most of its business at a below-median negotiated price, this would not be reflected in this data. Third, for the dataset to reflect a price point, there must be a negotiated price. To the extent a hospital provides a drug for free to a patient, we have no data point to capture that information.
Description of the Dataset Analyzed
+ Drugs priced. We have obtained a total of 52,180 individual negotiated prices, each reflecting a unique combination of hospital-payer-drug. None of the 123 hospitals disclosed prices for all of the 59 oncology drugs we examined, and we presume that each hospital carries a subset. The median hospital has negotiated prices for 23 drugs and, for each drug, we obtained negotiated prices from 55 hospitals (Exhibit 2). As expected, the number of hospitals carrying drugs closely paralleled the breadth of their medical use as suggested by the CMS dashboard. For example, Neulasta is carried by 100 of the 123 hospitals, Velcade by 93, and Alimta by 88. On the lower end of the range, the vast majority of hospitals did not have prices for late-launching biosimilars, e.g., Avsola (only 3 hospitals of the 123), Hizentra (3 hospitals), as well as secondary brands of commonly used products Octagam (IVIG, 5 hospitals) and Belrapzo (bendamustine, 8 hospitals). Here, we report analysis for drugs where we have negotiated price data from at least 10 hospitals.

+ Insurance line. Essentially all hospitals reported commercial insurance and those represented 85% of prices obtained, 65 hospitals reported Medicare advantage plans (10% of price data), Medicaid prices were reported by 30 hospitals and represent 3% of price data, and Medigap/other government prices were reported by 14 hospitals (1% of data). We suspect there has been some confusion about the need to report data from plans managed by commercial payers on behalf of government agencies, and thus the amount of data available for government-owned entities is lower.
Examining Hospital-Reported 340B Drug Prices and Profits
340B DSH Hospitals Charge Insurers 3.8 Times the Costs of Their Drugs
340B hospitals are entitled to a 23.1% ceiling price discount off of the ASP, but the discount can be higher if the drug price is increased above the rate of inflation. Drug companies may provide further discounts to 340B hospitals beyond the ceiling price, which is a common practice in competitive markets. The actual prices paid per drug are undisclosed; however, in 2020, CMS included the results of its 340B drug acquisition cost survey in its annual Hospital Outpatient Prospective Payment System rulemaking, which estimated the average discount at 34.7% off of the ASP.
In Exhibit 3, we calculated the median 340B hospital markup by comparing the hospital negotiated prices for insured outpatients to the published 3Q21 ASP, discounted by 34.7%, which is our estimate for the 340B hospital cost of the drug. The data shows 340B hospitals price drugs at 3.8 times their 340B acquisition costs. The increase in price does differ materially by the drug. The lowest median markup was 2.4 times (Adcetris) and the highest was 11.0 times (Epogen).

Examining the data, it immediately becomes apparent that the highest markup is for drugs in competitive markets, mostly biosimilars, and their reference drugs. In these markets, the purchase price hospitals pay are materially discounted vs. their WAC price (i.e., ASP << Wholesale Acquisition Cost (WAC)), while a lower level of markup is observed for drugs where hospitals are not able to obtain material discounts (and thus ASP is only few percent points below the WAC). Examining the relationship between WAC prices and 340B prices, we note a substantial, but more moderate and less variable median markup of ~1.8 times (Exhibit 4).

A few observations fall out of the data.
First, 340B hospitals markups are responsible for a significant portion of drug costs realized by the commercial employees. As a reminder, CMS reimburses non-340B hospitals and independent community oncology practices a 6% percent spread between the average cost of the drug (i.e., ASP + 6%), before the agency extracts the 2% sequestration cut. This spread, together with the administration fee, is viewed by CMS as the ‘fair value’ of service of administering the drug. 340B hospitals are reimbursed by CMS at a lower rate of ASP – 22.5% (before sequestration); however, 340B hospitals have a higher drug margin on Medicare patients because the government estimates their purchase price for drugs averages 34.7% of ASP. This alone is a handsome profit from Medicare patients for 340B hospitals. However, unlike CMS, the data show that commercial insurers are charged 3.8 times the acquisition price of oncology drugs to 340B hospitals, making the 340B hospital profit for treating commercial patients with cancer truly remarkable.
An example may be useful here. Darzalex, a Johnson & Johnson manufactured infused drug, is very effective and extensively used in the treatment of multiple myeloma. Treatment with Darzalex often extends beyond a full year of treatment. In its first year of treatment, in a common combination with Revlimid and Dexamethasone, an average-sized patient (75kg, 22.5 cycles) would be administered 27,000 mg of Darzalex.

Second, the analysis suggests that 340B drug discounts are captured by hospitals rather than being passed on. The U.S. has made a significant effort in encouraging drug price reductions through the introduction of biosimilars. These efforts have been successful in forcing prices down at the manufacturer level, as captured by the ongoing reduction in ASP prices. In the non-hospital segment, where commercial prices are also largely based on ASP prices, the discounts are passed on to insurers (and hopefully, employers). However, in the hospital segment (specifically, the 340B hospital segment), the incremental discounts are captured by the hospitals, which do not pass the discounts on to insurers. Thus, we posit that while Congress and other government agencies focus on the reduction of drug prices at the manufacturer level, addressing the costs at the hospital level is equally critical in reducing drug costs for patients, as hospitals account for roughly half of the use of oncology drugs (source)
Third, the pricing dynamics observed is also an extreme example of cross subsidy where commercial employers pay a price several times higher for the same drug as Medicare. Viewed from a hospital profitability perspective, after subtracting the cost of the drug, the difference is even larger. For example, a commercial patient in the Darzalex example above is worth almost 15 times ($213,696 vs. $14,259) more than a Medicare patient for a 340B hospital. It goes beyond the scope of this analysis, but economically, the much higher value of commercial patients could drive 340B hospitals to focus on the healthier/younger commercially-insured population away from the objective of the 340B program to focus on the less fortunate.
Last, the failure on the part of commercial insurers to rein in these drug costs is concerning. Unlike the public, insurers are clearly aware of the differences between what they pay hospitals and what CMS pays. Yet, the gap persists. We discuss the rationale for this below, but here we wanted to plant a seed in the reader’s mind that price transparency at the proximal buyer level may not be enough.
There is a Large Spread in Negotiated Prices Between Hospitals and Between Payers in the Same Hospital.
340B hospitals purchase drugs in a relatively narrow price ‘band’ as they all enjoy the same maximal allowable price and further discounts through the same GPO (Apexus). Thus, the difference in the prices charged between hospitals represent differences in their own pricing choices. One question is whether they all choose roughly the same markup? The answer is no. Comparing negotiated prices between hospitals across drugs show a shallow bell curve (or ‘fat tails’) distribution.
Comparing individual hospitals’ median prices for each drug to the median price across the hospitals, we find 14.3% of drug prices are less than 0.5 times the median price and 13.1% are more than 2.0x the median price across hospitals, (Exhibit 5). Further, prices appear to reflect a choice. Of the 91 hospitals reporting at least 10 individual drug prices, five consistently priced their drugs at 2 times the median and nine consistently priced drugs under 0.5 times the median.
Another intriguing question is the band of pricing within the same hospital to various payers. The observation is that we have a similarly broad band of prices, as well. Using Keytruda as an example and a plethora of hospitals, we show that the typical price band for Keytruda was ~2.4 times with the lower high to low spread being 30% and the highest exceeding 5 times (Exhibit 6).

Several important observations fall out of the data. The first being that 340B hospitals appear to be sophisticated pricers who practice a sharp form of price asymmetry, charging very different prices to payers, both across institutions and within the same institution. There are few industries that are able to introduce such differential pricing for the same service (maybe the airline industry). However, it argues against 340B hospitals being disinterested in pricing and just setting a fair price allows them to fulfill their not-for-profit mission.
The transparency within hospitals should allow insurers some negotiation room. Presumably, insurers were not aware of their relative price vs. other insurers within the same hospital. An insurer observing that its prices are high vs. same-size peers in the same hospital would presumably immediately argue against that price. In discussion with insurers, we have become aware that several have internal efforts to do just that.
That said, insurers are intermediaries. Their priority is to ensure their ability to compete vs. other insurers. Thus, while they may be offended by the 340B hospitals’ markups, the main concern of any insurer in negotiating agreements with hospitals is to ensure their payment to a given hospital fairly reflects their book of business with that hospital and thus allows them to compete effectively with other insurers. The availability of data will certainly help insurers further in ensuring they are in the right place in the pecking order, but we are not sure it will materially narrow the very large spread achieved by 340B hospitals.
Hospitals are Slow to Adopt Biosimilars
We noted above that 340B hospitals tend to price drugs at markup to their WAC price and retain that price even if manufacturer prices decline. Most biosimilars establish their WAC prices at a discount to the WAC price of the innovator drug (Exhibit 7) as this is needed to compete in the non-hospital segment. However, this does create an economic incentive for 340B hospitals to prefer innovator products because, for the same net-price level, they pocket higher profits.

Our data does not allow us to figure out which product is used more often, but we can observe which products hospitals provide negotiated prices for. Our data shows that hospitals list the branded products more often (Exhibit 8). Between 25% and 56% of hospitals list prices for only the innovator product and essentially none carry all the biosimilars. There are a handful of hospitals/molecules, we note, where only the biosimilars are listed.
Thus, overall, it appears hospitals are slow to adopt biosimilars. However, it is not a uniform observation. Most hospitals follow their economic incentives and use the innovator drugs alone. Others, either because they are required so by insurers, or because they agree with the need to reduce system costs, choose to include biosimilars. In discussions with the pharmacy staff of some 340B hospitals and biosimilar manufacturers, it became apparent to us there are several biosimilar evangelists within the community.

340B Hospitals Do Not Discount Products for Cash Paying or Uninsured Patients
Up to this point, we discussed the overall costs of drugs as charged by hospitals, largely ignoring the difference between direct OOP costs and the cost paid by the insurer (which flows indirectly to the patient in the form of premiums). Now we turn to discuss the price paid by cash-paying or uninsured patients.
Costs for uninsured patients are easy to obtain as they are explicit reporting requirements by the CMS regulation. In Exhibit 9, we show the relative markup of cash prices vs. the median hospital insurance negotiated price. The data shows that hospitals are charging cash-paying patients roughly the same as the median commercial prices (1.02 times).
This observation is obviously problematic. About 8% of the U.S. population was uninsured in 2019 and the mandate of the 340B designated hospitals certainly includes providing affordable care to this segment. (In fact, 340B institutions’ main response to criticism is that they use the 340B economics to address the uninsured). The idea they charge these patients the same 3.8 times their purchase price does not fit with this mission. We are unaware of a rationale for this pricing approach (these are not the kind of institutions that attract cash-paying affluent international clientele). Recent media publications suggest cash-paying or uninsured patients may be paying more than the insured, with the silver lining that a larger sample employed here suggests that with drugs this is not the median case.

Conclusion and Discussion
The data presented in this report paints a picture of hospitals pricing drugs aggressively.
- The ‘spread’ between the discounted 340B purchase price and the price charged to insurers or patients in 340B hospitals is 3.8 times at the median.
- 340B hospitals are not reducing prices they charge insurers or patients when their acquisition prices decline, negating efforts to reduce prices at the manufacturer level.
- There is pricing inconsistency between hospitals with some pricing drugs 2 times more than the median (i.e., 7.6 times their acquisition price or more) and even within hospitals, charges usually vary dramatically.
- 340 B hospitals are slow to adopt biosimilars.
- Most problematically, 340B hospitals cash-paying customers the same as the median price of insurers, i.e., 3.8 times their acquisition costs to patients paying cash. In short, to the extent 340B institutions fulfill their mission of providing lower cost care, we are not seeing it reflected in their drug prices.
An intriguing question is, why have insurers not acted to reduce drug prices? As we noted above, insurers were aware of the gap between the price they pay and what CMS pays. They also had some aggregated pricing data (which benefit consultants sell to them). We have heard four hypotheses for this observation. First, the balance in the negotiating position is often not on the insurers’ side. While the largest insurer in a given geography may be in a position to negotiate better prices, more moderate size insurers do not and merely accept the hospital price. Second, insurers have largely not focused on drug costs both for organizational reasons (hospital costs are administered separately and locally, while drug costs are managed nationally via the pharmacy benefit manager (PBM)) and, because until recently, outpatient drugs were not a big cost center, although they have been growing quickly as the Medicare Part B cost trend suggests. Third, insurers are focusing on shifting drug usage to non-hospital settings (either community clinics or specialty pharmacies) rather than attempting to negotiate prices with hospitals. Last, and least charitable, insurers are intermediaries. As long as they do not pay more than their peers and costs rise at a moderate enough rate to cause disruption of the system, insurer interests lie elsewhere.
Thus, the importance of pricing transparency is beyond the insurance layer. It is evident from the current situation that the drug price situation in 340B hospitals is problematic and relying on the current market structure to curb costs has not been effective. Making drug prices visible to a broader cohort of stakeholders – primarily employers but also regulators and the public will create some pressure on hospitals to control their prices, notably those seeking advantages from the public purse. The recently published executive order instructs the HHS Secretary to further enhance hospital price transparency data. We applaud this direction and have suggested some ideas where to focus in the earlier part of this report.
Will transparency be enough? We are uncertain. The health care system has proven resistant to change across multiple dimensions (electronic records, patient-generic settlements, etc.) and the arguments in favor of 340B institutions are well known. It usually requires legislative or regulatory changes modifying the ‘rules of the road’ to get a change to take place. One may be needed here to effectuate change.


