Examining Hospital Price Transparency, Drug Profits, and the 340B Program 2022
Key Takeaways
- The Community Oncology Alliance (COA) examined the self-reported drug pricing data for 49 of the top acute care disproportionate share hospitals (DSH) participating in the 340B Drug Discount Program (340B) based on a database ranking of their estimated volume of 340B discounts they receive. This accounts for approximately 23 percent of the total estimated 340B discounts realized by all 340B DSH hospitals (referred to as “340 hospitals” in this paper) in 2021. Because the majority of 340B hospitals are still not compliant with government regulations requiring that they report services and drug pricing data for public use, we had to examine 117 of the top 340B hospitals to arrive at the 49 hospitals used in this study.
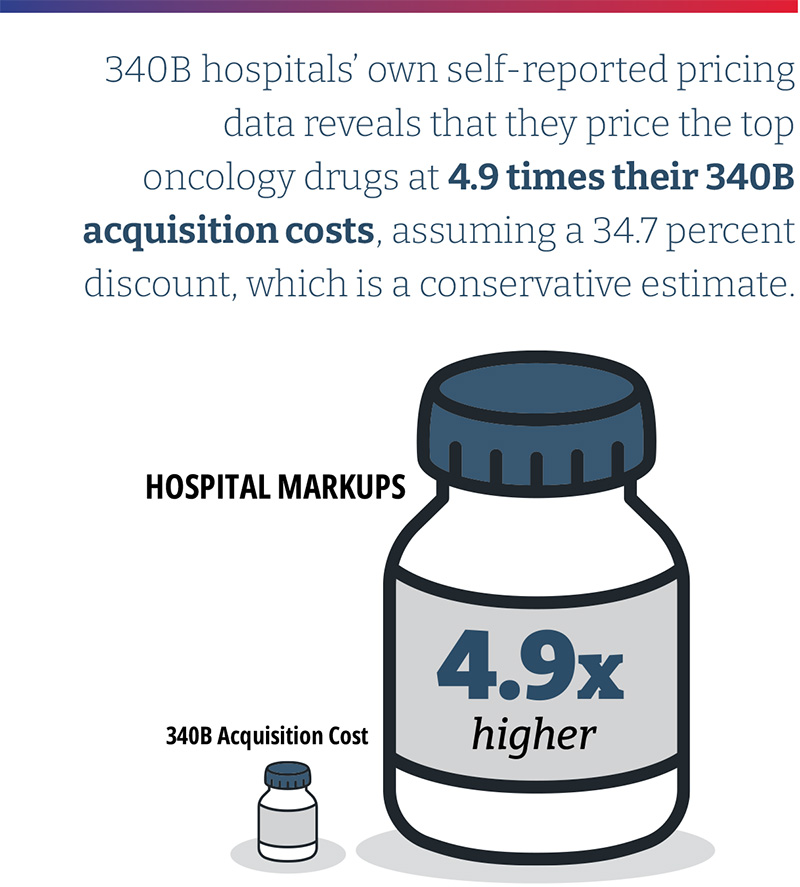
- 340B hospitals’ own self-reported pricing data reveals that they price the top oncology drugs at 4.9 times their 340B acquisition costs, assuming a 34.7 percent discount, which is a conservative estimate based on 340B hospital survey data collected by the Centers for Medicare & Medicaid Services (CMS). This is the median drug price mark-up of the oncology drugs studied and differs materially by drug. The lowest average markup was 3.2 times (Kymriah) and the highest was 11.3 times (Faslodex). When the median markup is calculated after excluding the three CAR T products, the median markup is slightly higher at 5.0 times 340B hospital acquisition costs.
- Hospitals remain slow to adopt biosimilars. For certain products, up to 26 percent of hospitals were found to only list prices for an innovator product but not its biosimilar and only 10 hospitals carry all of the biosimilars studied. This may suggest that hospitals are generally still slow to adopt lower priced biosimilars rather than the more expensive innovator drugs.
- Cash paying patients, of whom many may be uninsured, receiving care at 340B hospitals do not seem to receive discounts on their drugs. Unfortunately, only two of the 49 hospitals with compliant reporting data shared cash prices, but for those we found that hospitals charge approximately 3.2 times Average Sales Price (ASP) for commercial plans and charge cash-paying patients 3.0 times ASP. These trends are consistent with prior findings that hospitals charge nearly the same price for cash paying customers as those with commercial insurance coverage.
Background
Hospital spending has continued to grow rapidly (by more than six percent annually), both before and during the pandemic, and most recently represented $1.3T, equivalent to 31 percent of total national health care spending and almost seven percent of the U.S. Gross Domestic product.1 The steady growth and consolidation of the hospital sector has led a range of stakeholders to demand more transparency and accurate price reporting to better inform decision-making.2 It has also raised serious questions about the degree to which deep 340B Drug Pricing Program discounts may have fueled this s growth and consolidation.3
Originally established to help a relatively small group of safety-net hospitals spread scarce resources, the 340B program is now seen as a major revenue source by 44 percent of the nation’s hospitals, particularly in cases when they utilize the discount program on patients with insurance and retain the spread between the deeply discounted 340B price and insurance reimbursement.4,5 There is no clear definition of eligible 340B patients and there are no requirements for 340B hospitals to pass savings to patients, though there is an implicit expectation that these facilities would reinvest the funds to support care for patients in need of financial assistance. Yet, concerns about the lack of transparency into how much money 340B hospitals generate from the program or how they use it have also augmented the calls for increased hospital price reporting.6
Under the federal Price Transparency Rule that went into effect in January 2021, hospitals are required to disclose their standard charges and CMS is responsible for evaluating and enforcing hospital compliance with the requirements prescribed in the rule. In September 2021, the Community Oncology Alliance (COA) commissioned a report7 that highlighted concerns around hospital compliance with transparency regulations and analyzed potential hospital drug profits within the 340B program. The report revealed the aggressive pricing tactics taken by hospitals, including a high spread between 340B purchase price and the prices charged to insurers and patients. The report noted that 340B hospitals maintain high prices for drugs even as acquisition prices decline, pricing was inconsistent between hospitals, there was slow adoption of biosimilars, and cash-paying customers were charged the same prices as insurers, a median of 3.8 times their acquisition costs.
Since the September report, some hospitals that had previously not reported payer price data have now made this information public, providing an opportunity not only to refresh the results of the previous analysis but also to look closer at the top 340B hospitals in terms of estimated 340B “profits.”
The availability of additional transparency data allows for more in-depth review and comparisons. This year, COA has refreshed the initial analysis with a more targeted approach. In this update, we focus on a subset of top 340B hospitals (based on the volume of estimated 340B discounts received) and a targeted list of highly utilized oncology products. In this report, COA discusses recent 340B litigation and its impact on hospitals and hospital compliance with transparency requirements, suggestions to improve hospital price transparency reporting data, and hospital-reported 340B drug prices and profits.
Recent 340B Litigation and Its Impact on Hospitals
In 2018, the Department of Health and Human Services (HHS) reduced reimbursement rates for Medicare Part B drugs acquired through the 340B program from ASP+six percent to ASP-22.5 percent, with exemptions for certain types of hospitals. The change was recommended by the Medicare Payment Advisory Commission (MedPAC) because statute requires Medicare reimbursement for Part B in hospital outpatient departments (HOPDs) to be set at average acquisition cost. CMS had been using ASP+six percent as a proxy for average acquisition cost, which according to MedPAC, far exceeds the acquisition costs for 340B entities. In the CY 2018 Outpatient Prospective Payment System (OPPS) final rule, CMS noted that the reductions in reimbursement rates for 340B-acquired Part B drugs better reflect the resources used to acquire drugs and would provide Medicare beneficiaries with lower co-pays. The rule also noted that 340B discounts may lead to unnecessary utilization and potential overutilization of drugs by 340B eligible hospitals, in addition to the rapid growth of the 340B program.8
As a result, the American Hospital Association (AHA) filed suit against HHS, claiming that the agency exceeded its statutory authority because the method used to adjust Part B reimbursement rates under the 340B program was not specified in statute. The U.S. District Court of the District of Columbia ruled in AHA’s favor, which prompted HHS to conduct a survey in April 2020 on drug acquisition costs among 340B hospitals for calendar years (CYs) 2018 and 2019. HHS later reported that the survey data found higher discounts on 340B drug acquisition — 34.7 percent — than discounts underlying the reimbursement rate set in 2018, but nonetheless announced its intent to retain the payment rate of ASP-22.5 percent in every year since. The U.S. Court of Appeals for the D.C. Circuit then overturned the district court’s ruling in favor of HHS, stating that the reduction in reimbursement rates was permissible under Chevron deference and the Supreme Court of the United States (SCOTUS) agreed to hear the case.9
In June 2022, SCOTUS issued its opinion in AHA v. Becerra, concluding that HHS can set reimbursement rates based on average price and it is permissible for the agency to adjust prices. However, SCOTUS ruled that HHS may not vary reimbursement rates for 340B hospitals without first conducting a survey of hospital drug acquisition costs. As a result, the court ruled that HHS acted unlawfully when it reduced reimbursement rates for 340B hospitals for 2018 and 2019, prior to the survey of 2020.
The court ruled that HHS can set reimbursement rates for outpatient drugs in two ways. Under option 1, HHS can set reimbursement rates based on hospitals’ average acquisition costs for each drug and can vary reimbursement rates by hospital group. If HHS does not conduct a survey of hospital acquisition costs and if data are not available, HHS may proceed to option 2. Under option 2, HHS can obtain drug pricing data from drug manufacturers and set reimbursement rates based on the average price for a drug as calculated and adjusted by the HHS Secretary. However, this option does not authorize HHS to vary reimbursement rates by hospital group. Instead, HHS must set uniform reimbursement rates for each covered drug, which must be equal to the average price of that drug during that year.
While reimbursement for 340B drugs will remain at ASP-22.5 percent for the remainder of 2022, CMS notes in the CY 2023 OPPS proposed rule that the agency likely plans to return to a reimbursement methodology of ASP+six percent in 2023, offsetting the increased spending on drugs with a decrease to the conversion factor for hospital reimbursement. This means that Medicare will pay much more for Part B drugs than what 340B hospitals acquire them for, as will Medicare beneficiaries. Given the mark-ups on drugs by 340B hospitals in the commercial sector, as well as with uninsured patients, the hospitals will have even more incentive to use more drugs and more expensive drugs.
Assessing Hospital Compliance with CMS Transparency Regulations
As part of the Affordable Care Act (ACA), Congress enacted section 2718(e) of the Public Health Service Act, which requires each hospital to “make public (in accordance with guidelines developed by the Secretary of the Department of HHS) a list of the hospital’s standard charges for items and services provided by the hospital.” CMS initially required hospitals to make their list prices available (the “chargemaster”) and subsequently revised its guidance in November 2019 to capture additional data points related to pricing.
The finalized CMS hospital price transparency regulation requires that hospitals publish, among other items, a “machine-readable” file containing prices for all “items and services” provided by the hospital to patients for which the hospital has established a standard charge. These published prices must include (i) the chargemaster price, as in prior regulation, (ii) the price for cash paying customers, (iii) the de-identified minimum and maximum negotiated prices and, critically, (iv) the payer-specific negotiated charges, which is the rate that a hospital has negotiated with each third-party payer.
340B drug purchases have risen from $4B per year in 2007-2009 to $38B in 2021, increasing by $6B alone from 2020 to 2021. Hospitals account for 87 percent of 340B purchases.
The hospital industry has heavily lobbied against the regulation during its notice and comment period and the AHA challenged the rule in court, arguing the law only mandates the publication of chargemaster prices. However, the court ruled in favor of CMS, and the new regulation went into effect on January 1, 2021.10
Since the regulation came into effect, the AHA has continued to argue for its cancellation and leniency in enforcement.11 The regulation included a civil penalty for non-compliance of up to $300 per day ($109,500 annually) — an insignificant amount for many U.S. hospitals that did not appear to compel broad compliance. In fact, in early 2022, only 14 percent of hospitals complied with CMS’ hospital price transparency regulation.12 This is only slightly higher than the 11 percent of 340B hospitals that were found to be compliant in 2021.13 In the CY 2022 rulemaking cycle, CMS finalized modifications to the civil penalty for non-compliance to $300/day for hospitals with less than 30 beds and a penalty of $10/bed/day for hospitals with greater than 30 beds, with a maximum daily penalty of $5,500. Under this approach, penalties would range from $109,500–$2,007,500 per hospital.14 To date, only two hospitals have been fined for noncompliance.15, 16
Concerns about the rapid growth of the 340B program have led to calls for greater transparency into the margins hospitals make on 340B products and the way they use these funds to support patient care and affordability. For example, between 2000 and 2020, the total number of covered entities and their child sites participating in the 340B program rose from approximately 8,100 to approximately more than 50,000, with 340B hospitals accounting for ~60 percent of sites in 2020. 340B drug purchases have risen from $4B per year in 2007-2009 to $38B in 2021, increasing by $6B alone from 2020 to 2021.17, 18 The $44B in 2021 340B drug purchases equates to $94B valued at drug list prices, which is about 14 percent of the total.19 Hospitals account for 87 percent of 340B purchases.20 The availability of transparent hospital prices offers an opportunity to better inform both the debate on 340B hospitals and patients who seek medical care.
Moreover, the government allows 340B participants without pharmacies to distribute drugs to patients via third-party pharmacies known as contract pharmacies, which also have been subject to increased scrutiny.21, 22 Until 2010, 340B contract pharmacies were predominantly independently-owned, local community pharmacies, but by 2018 about 75 percent of them were chain pharmacies.23 The problem began in 2010 when the agency tasked with overseeing the 340B program, the Health Resources and Services Administration, said all 340B participants, even those with their own pharmacies, could contract with an unlimited number of third-party pharmacies. Between April 1, 2010, and April 1, 2020, the number of contract pharmacy arrangements increased 4,228 percent, and they now account for 28 percent of 340B revenue.24, 25 The five largest specialty pharmacies account for more than 20 percent of total contract pharmacy relationships with 340B entities and are also owned by, or corporately affiliated with, pharmacy benefit managers (PBMs).26 This has allowed 340B hospitals, PBMs, and their affiliated for-profit contract pharmacies to expand their reach and continue fueling 340B program growth and increasing their profits through the program at the expense of patients in need.
What We Did: Methodology and Data Limitations
We selected a list of 27 oncology treatment and supportive drugs to study. The drugs were selected primarily based on being the highest dollar expenditure for Medicare Part B cancer drugs in 2019 augmented with lower expenditure drugs sharing the same active ingredient, either generic or biosimilar. 27
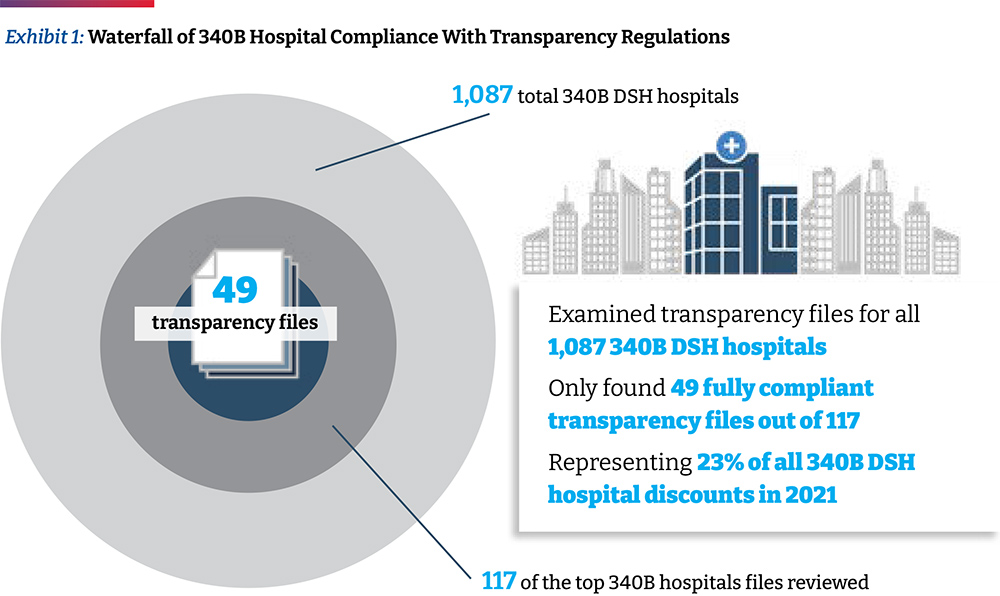
In a previous analysis, a list of 1,087 340B hospitals was accessed and analyzed whether they complied with the updated (January 1, 2021) hospital transparency regulation or if they only provided chargemaster data required by the pre-2021 regulation. When price data relevant to the regulation was found in the data file (e.g., minimum price, cash price), they were considered as “attempting to comply.” In this analysis, using the same list of 1,087 acute care 340B hospitals, we took the initial step of arranging hospitals by their share of operating costs (of all 340B hospitals) from highest to lowest. Assuming that operating costs are proportional to 340B discount dollars received, this ordering of sites also represents the order of hospitals with highest to lowest share of 340B discounts. Working down the list to identify ~50 hospitals with compliant files available, it required review of 117 of the top 340B hospitals to identify 49 useful hospital price transparency files for this analysis. (One hospital of the 50 was ultimately not used due to incomplete and questionable data.) (Exhibit 1) The 49 hospitals analyzed represent 23 percent of the total 340B discounts realized by all 340B DSH hospitals in 2021, which on a per hospital basis is an estimated $86 million to $162 million. It is notable that only eight of the top 20 340B DSH hospitals with the highest estimated 340B discounts reported useful transparency data.
We note that the 340B discount percentage used in this analysis is the average discount percentage that CMS arrived at in its 2020 survey of 340B hospitals. However, as CMS notes, and has been referenced elsewhere, this is a conservative average 340B discount. In fact, based on actual 340B purchase data, it has been recently estimated that 340B discounts off of drug list prices are at least 53 percent. As a result, findings of this study on drug price mark-ups are significantly underestimated.
Description of the Dataset Analyzed
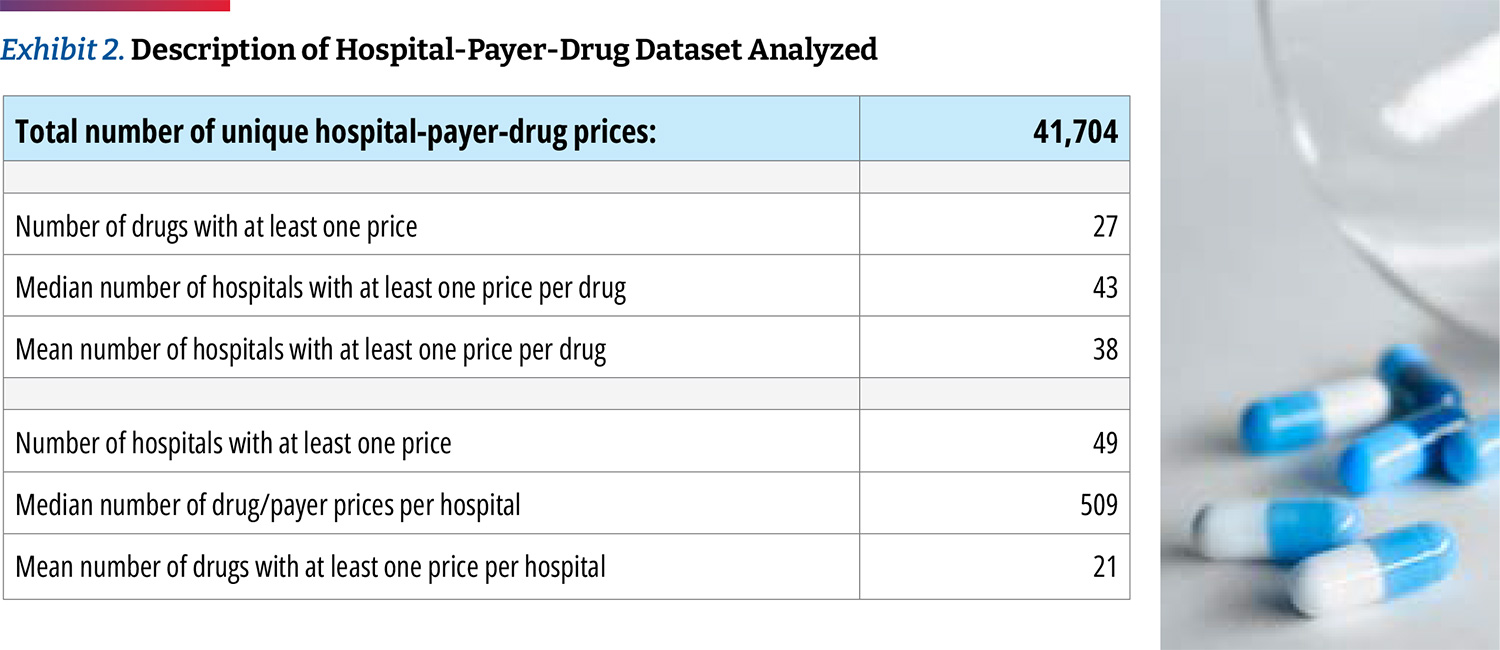
We obtained 41,704 individual negotiated prices from the hospitals own self-reported data files, each reflecting a unique combination of hospital-payer-drug. Only two of the 49 fully compliant hospitals disclosed prices for all of the 27 oncology drugs that we examined, and we presume that each hospital carries a subset. Our analysis found that the median hospital has negotiated prices for 22 of the drugs. We obtained negotiated prices from 43 hospitals (median number of hospitals with at least one price per drug). (Exhibit 2)
To illustrate the variability in terms of data available, we found that prices were available for Abraxane for all hospitals. In addition, Faslodex and Yervoy were carried by 48 of 49 hospitals. Prices were also commonly available for Kyprolis, Opdivo, and Keytruda. Meanwhile, the vast majority of hospitals did not have prices for CAR T-cell products such as Tecartus (only seven out of 49 hospitals), Kymriah, and Yescarta (15 hospitals each). Aside from CAR T-cell products, Herceptin (15 hospitals), Neulasta (26 hospitals), and Rituxan (29 hospitals) were among the least reported prices.
Examining Hospital-Reported 340B Drug Prices, Markups, and Profits
The discounts that 340B entities negotiate with manufacturers are not publicly available and vary by hospital and by drug. The minimum required discount, which determines the 340B ceiling price, is calculated based on a formula tied to either Best Price or to the 23.1 percent mandatory discount in Medicaid. However, most 340B discounts can be higher, including if the drug price is increased above the rate of inflation.
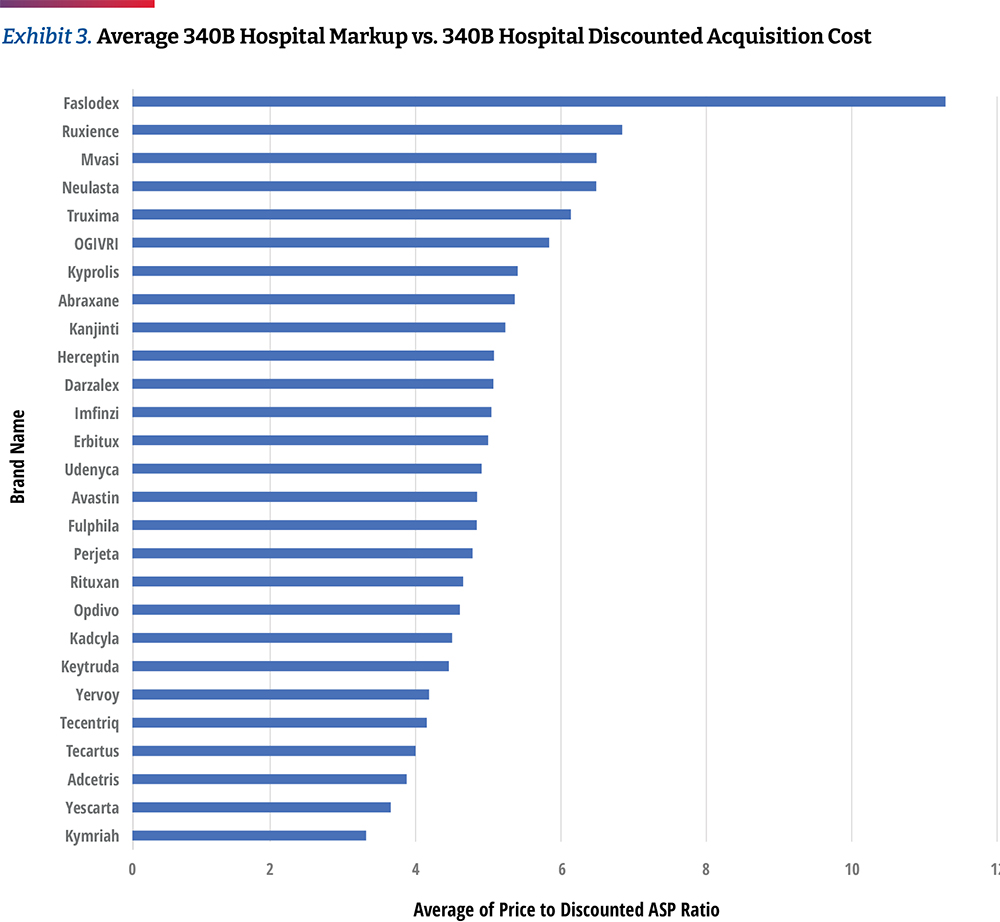
In Exhibit 3, we calculated the average 340B hospital markup by comparing each hospital’s negotiated prices for insured outpatients to the published April 2021 ASP Drug Pricing File, discounted by 34.7 percent, which is based on CMS survey data released in the OPPS CY 2021 final rule. However, other sources suggest that average 340B discounts could be much higher than 34.7 percent. For example, Janssen’s 2021 U.S. price transparency report estimates average 340B discounts to be 66 percent.28 Therefore, the use of a standard 34.7 percent discount in our calculations represents a conservative approach to assessing markup trends.
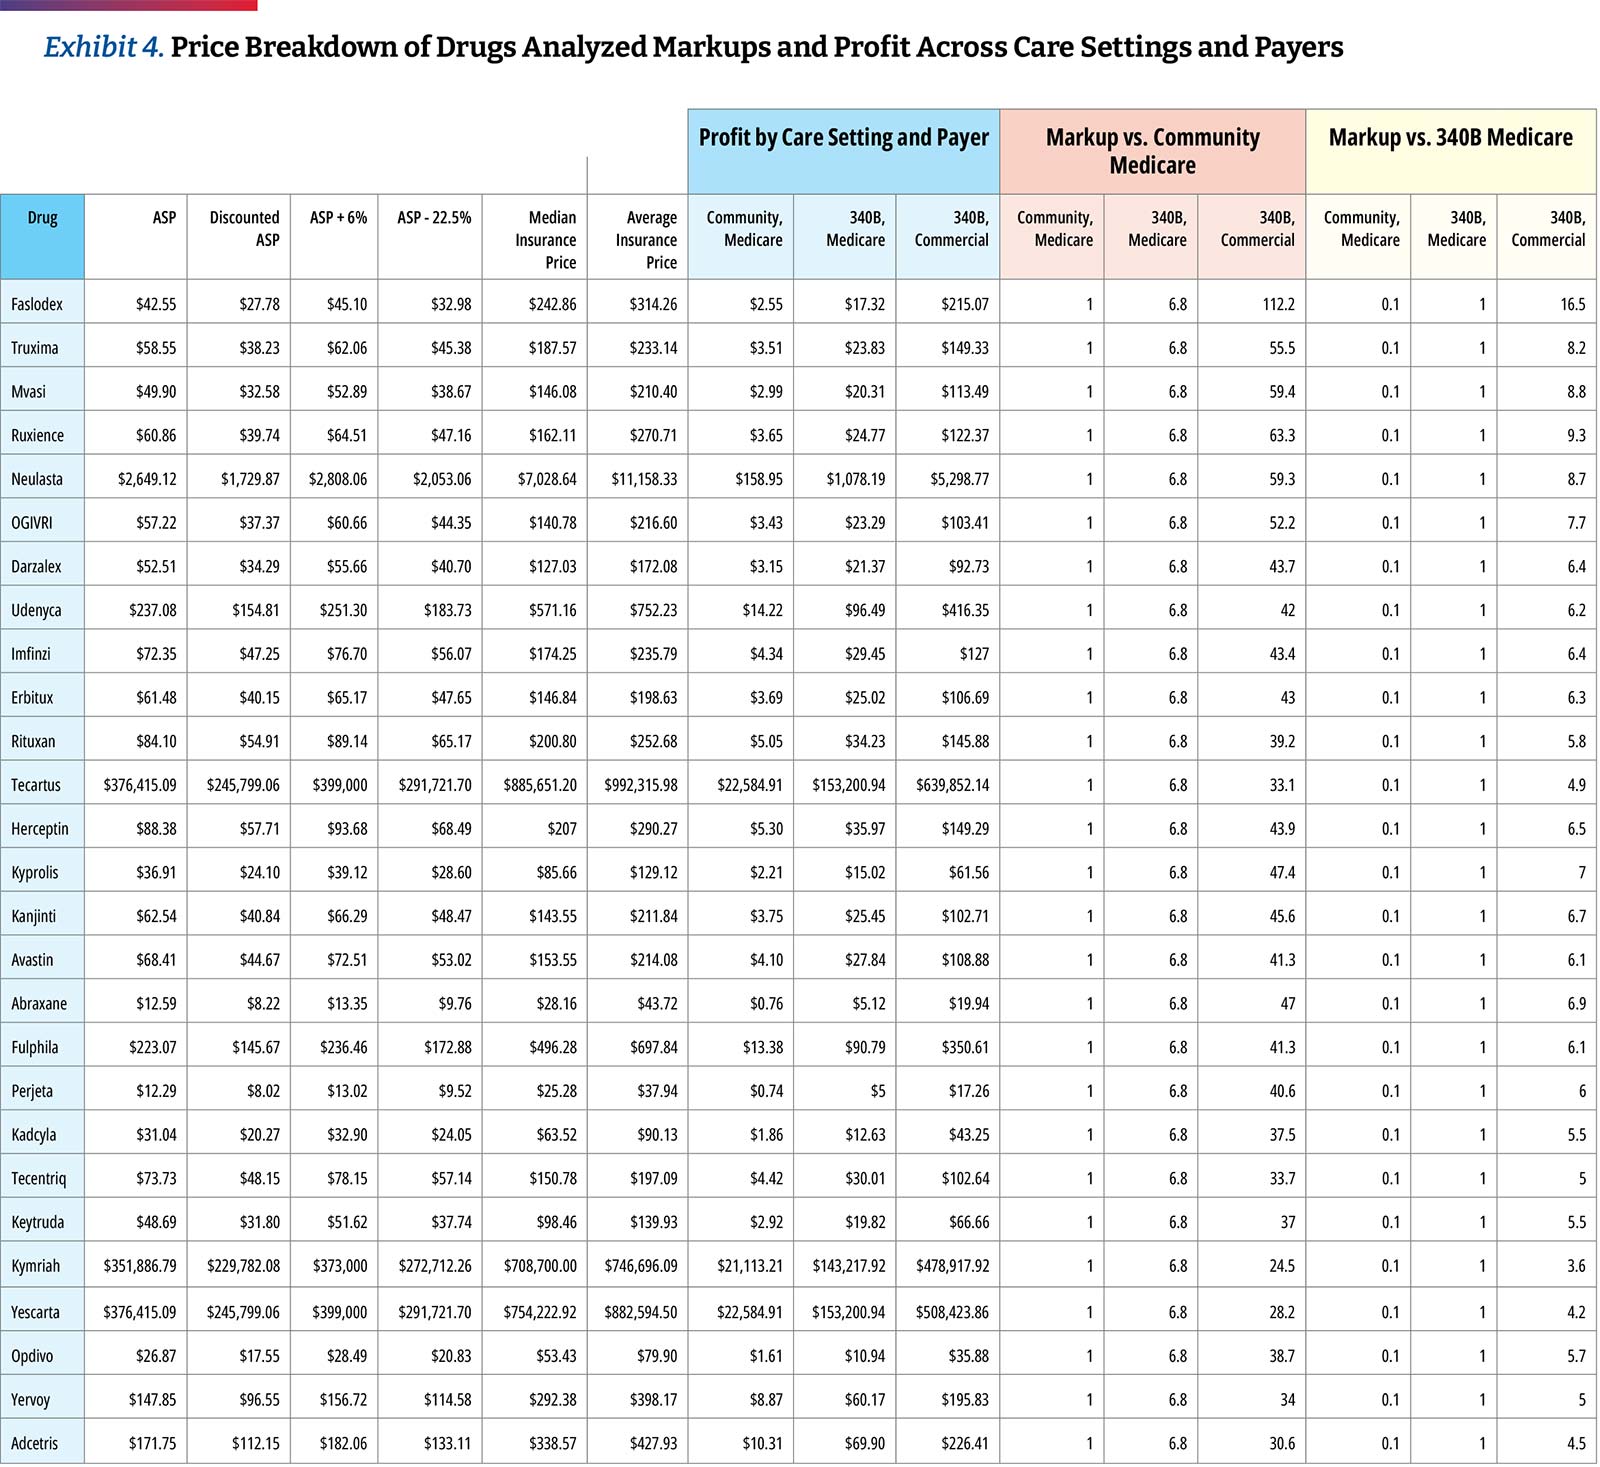
Based on the assumption of a 34.7 percent discount, the hospital transparency data reveals that 340B DSH hospitals price drugs at a median of 4.9 times their 340B acquisition costs, and the price markup differs materially by drug. The lowest average markup was 3.2 times (Kymriah) and the highest was 11.3 times (Faslodex). If median markup is calculated after excluding the three CAR T-cell products, the median markup is slightly higher, at 5.0 times 340B acquisition costs. As high-cost cell and gene therapies enter the market, with prices ranging from several hundred thousand dollars to more than $2M, some approaches to contracting for drug reimbursement may need to be altered. However, the available price transparency data shows that hospital providers are realizing significant markups on these products, with an opportunity for enormous margins, especially if acquired through the 340B program. (Exhibit 4)
Similar to our prior analysis, the results of this study confirm the highest markup is for biosimilars and their reference drugs.29 Hospitals are purchasing biosimilars and their reference products at a notably discounted rate in comparison to their price. When observing the relationship between ASP and 340B prices, we found more substantial average markups of approximately 5.5 times between biosimilars and their reference products.
Key Findings on 340B
1
340B Hospital Gains From Commercial Plans
As discussed previously, CMS reimburses non-340B hospitals at six percent above the average cost of the drug (i.e., ASP+six percent), before a two percent sequestration cut. Between 2018-2022, 340B hospitals were reimbursed at the lower rate of ASP-22.5 percent (before sequestration) and the government estimates that their drug purchase price averages 34.7 percent of ASP. In 2023, CMS expects to return to a methodology of reimbursing 340B hospitals at ASP+six percent for 340B-acquired drugs. This analysis shows that commercial insurers are charged 4.9 times the acquisition price of oncology drugs by top 340B hospitals, presenting the opportunity for major profits from such significant margins.
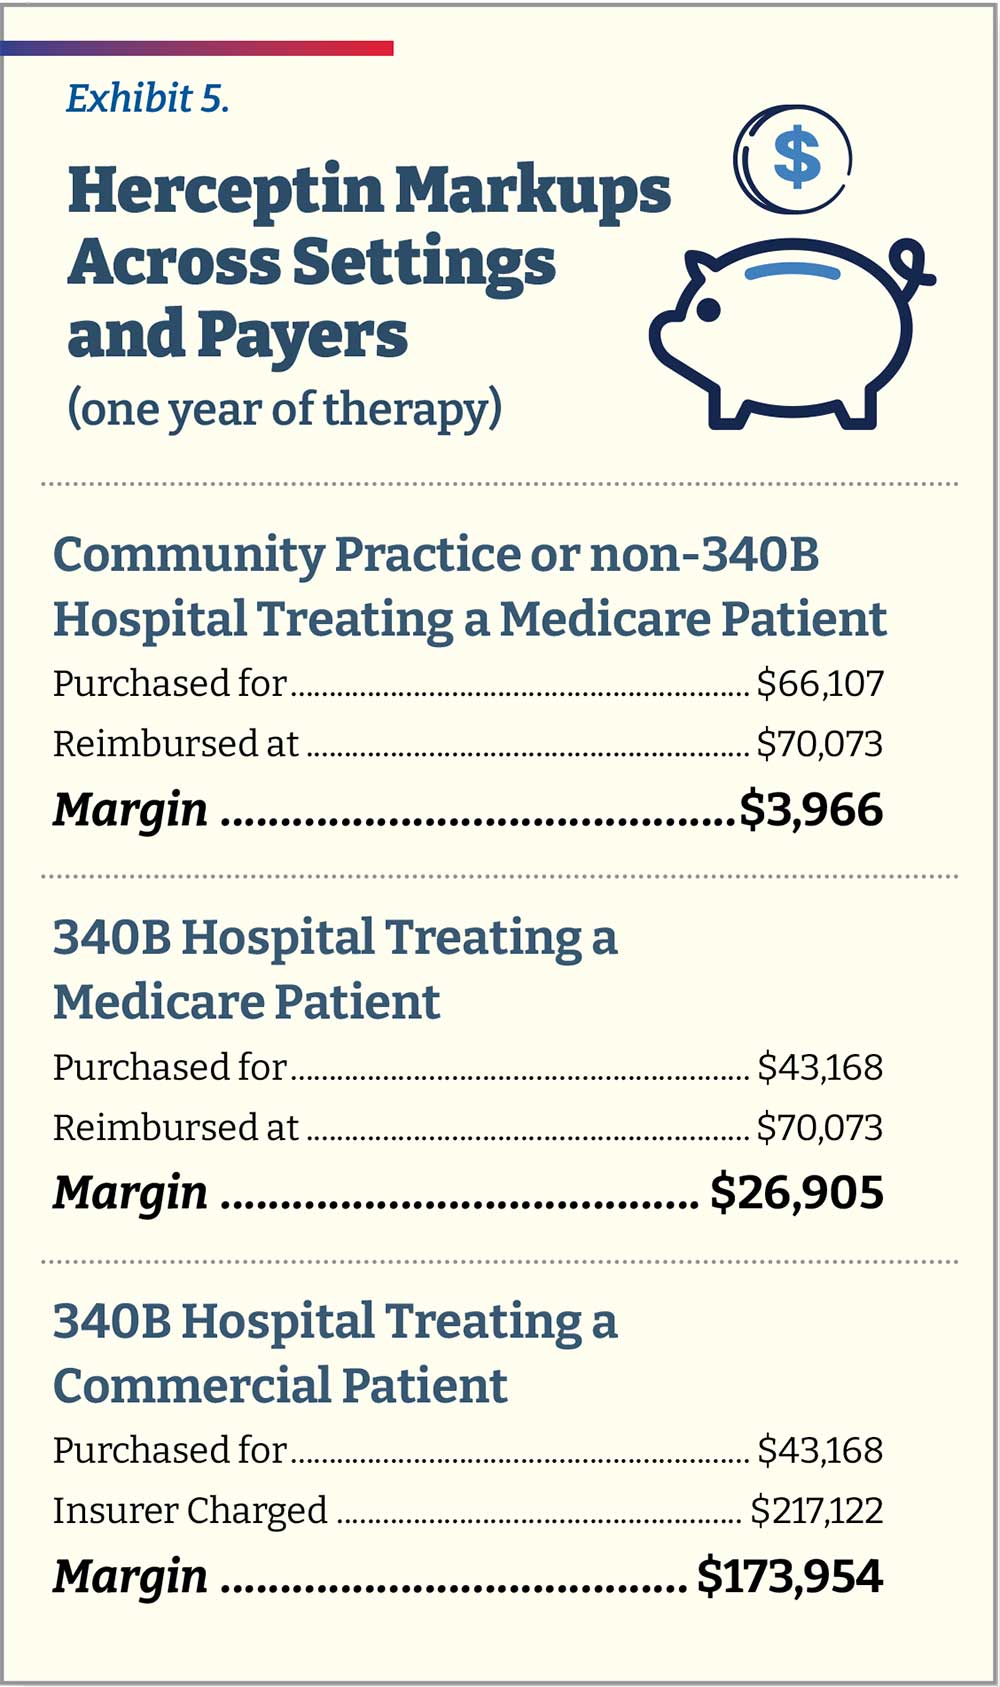
To help exemplify this markup in real dollars, consider the case of trastuzumab (Herceptin), a monoclonal antibody used to treat breast and stomach cancers. An independent community oncology practice (or non-340B hospital) treating a Medicare patient with breast cancer over the course of one year of therapy would purchase Herceptin for $66,107 and be reimbursed $70,073 (ASP+six percent, before sequestration). It would thus make $3,966 in pricing spread for treating that patient. A 340B hospital treating the same patient would purchase the same amount of Herceptin at $43,168 (34.7 percent lower than ASP) and be reimbursed by Medicare at the same level of ASP+six percent (total $70,073), assuming CMS finalizes plans to revert to this payment methodology in 2023. The hospital would thus make $26,905, approximately 6.8 times the amount of non-340B providers for the same Medicare patient. A 340B hospital treating a commercial patient with breast cancer over one year will still purchase the drug at $43,168. However, it will now charge the commercial patient’s insurance slightly more than 5.0 times that amount, totaling $217,122 for a spread of $173,954, about 6.5 times more than the spread a hospital would receive for an identical Medicare patient and 43.9 times more than the spread for a community oncology practice or non-340B hospital. (Exhibit 5)
The analysis also shows the significant 340B drug discounts captured by hospitals that may not be passed down to patients. These price markups and opportunities for profit are exacerbated depending on the payer. We looked at the median spread across all 27 products and then compared them to commercial plans. We found that when commercially insured patients are treated at a 340B hospital, the median spread on a product is 7.4 times that for a Medicare patient ($188.54 vs. $25.45).
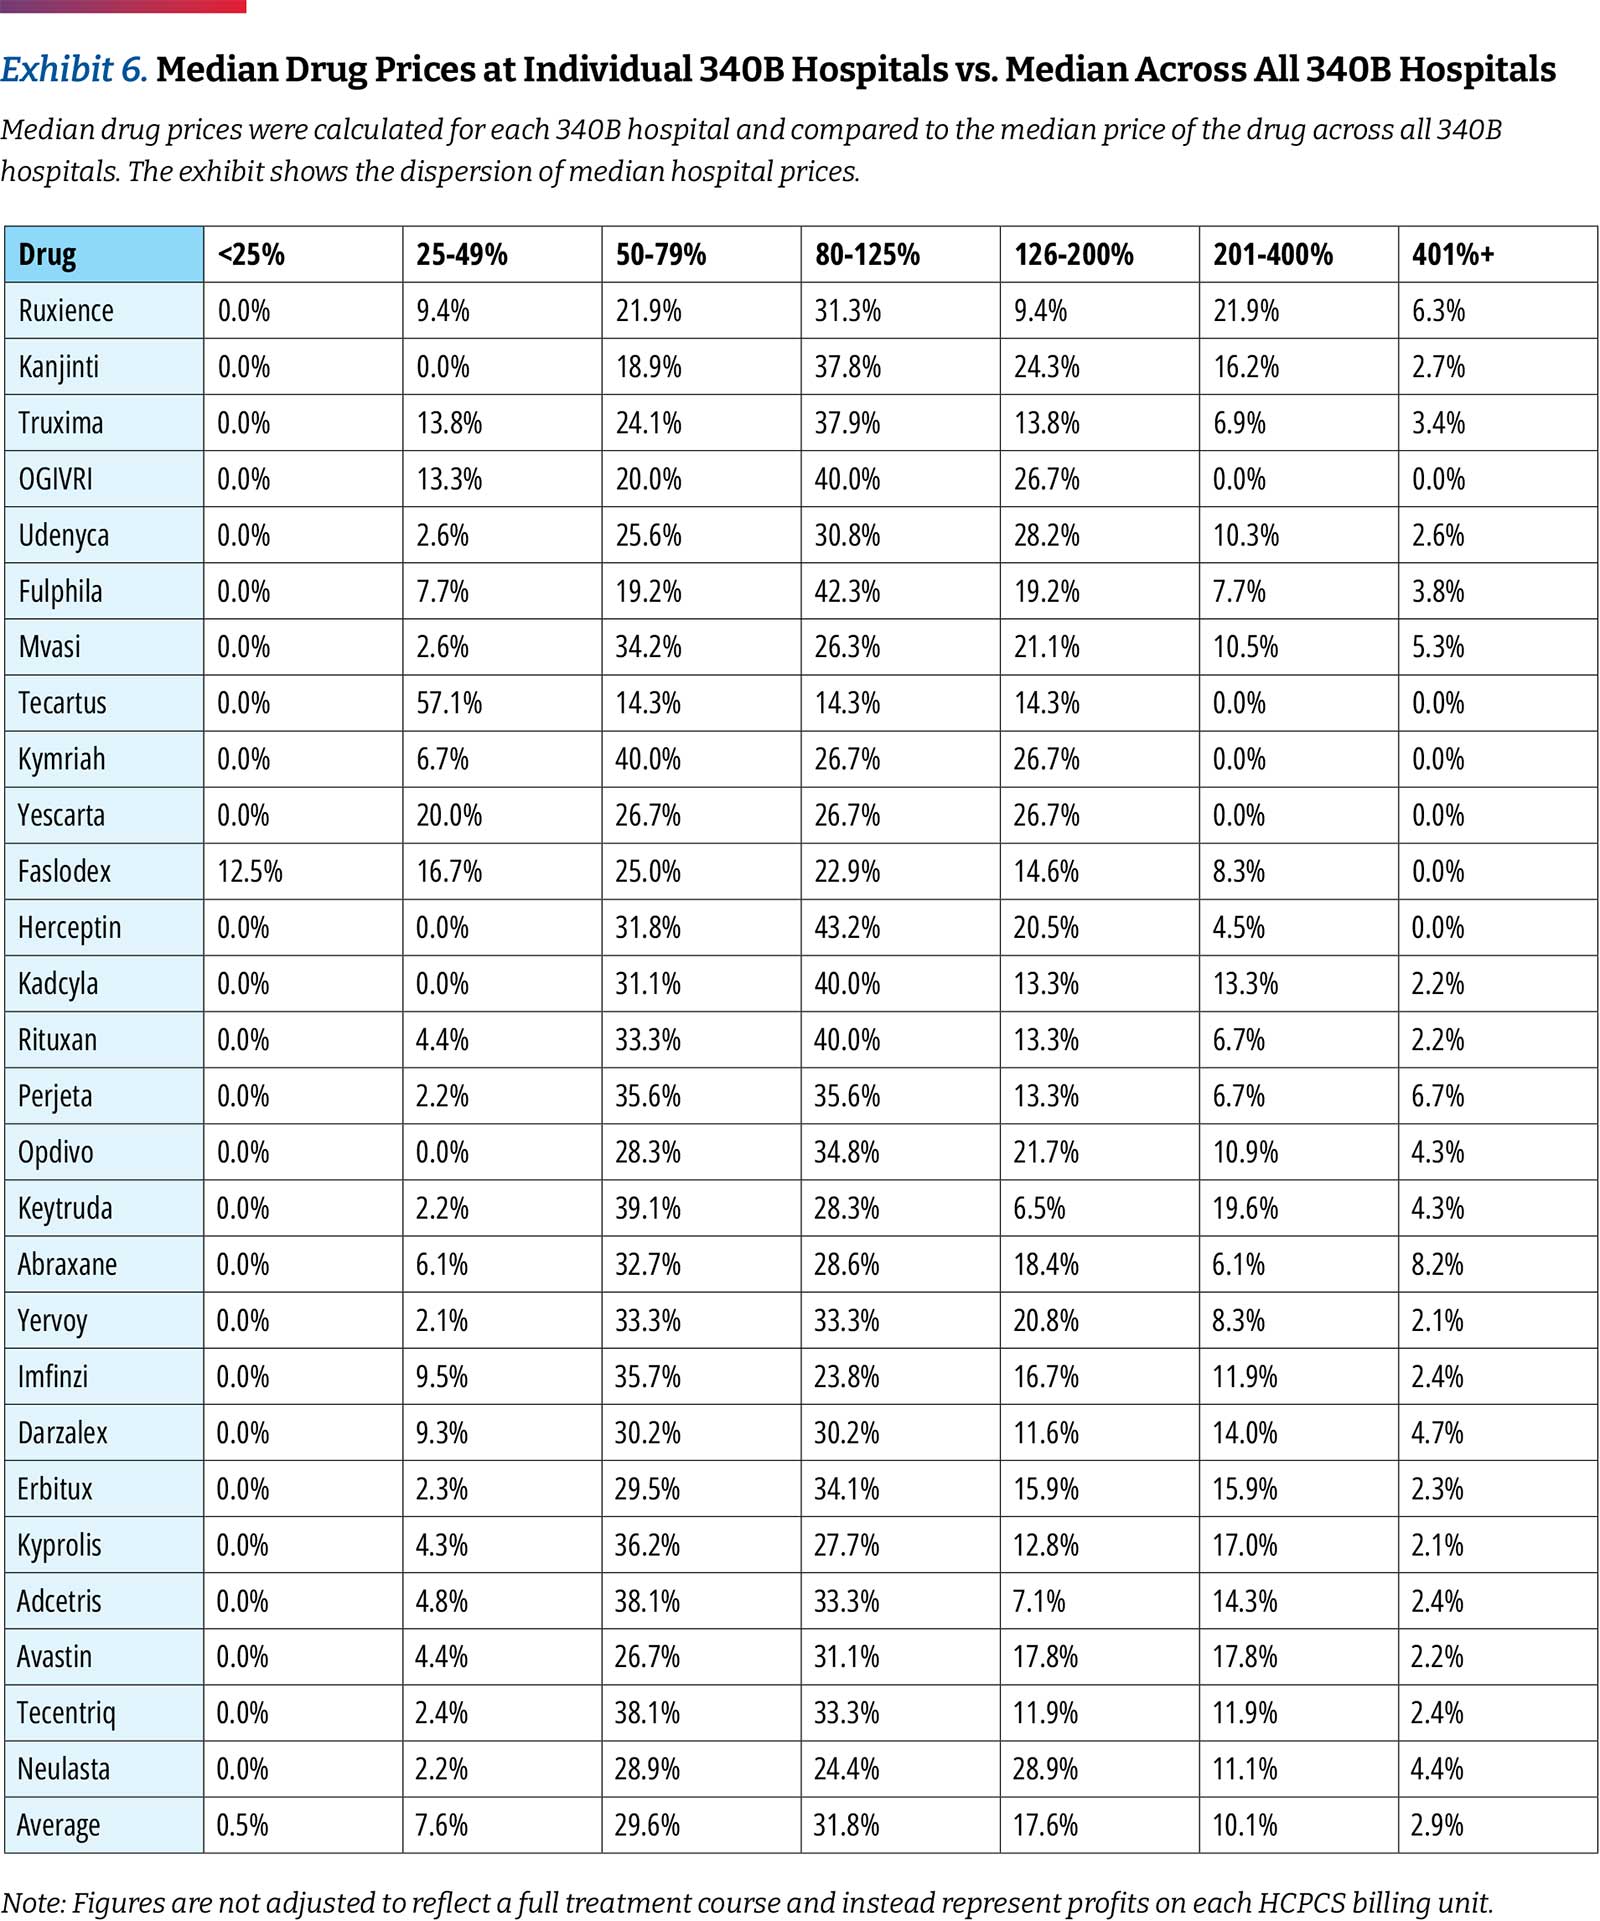
While 340B hospitals generally purchase drugs within the same narrow price band, there are differences in prices charged between hospitals. When comparing individual hospitals, this analysis found that 8.1 percent of drug prices are less than 0.5 times the median price and 13 percent are more than 2.0 times the median price across hospitals. (Exhibit 6)
2
There Is a Large Spread in Negotiated Prices Between Hospitals and Between Payers Within the Same Hospital
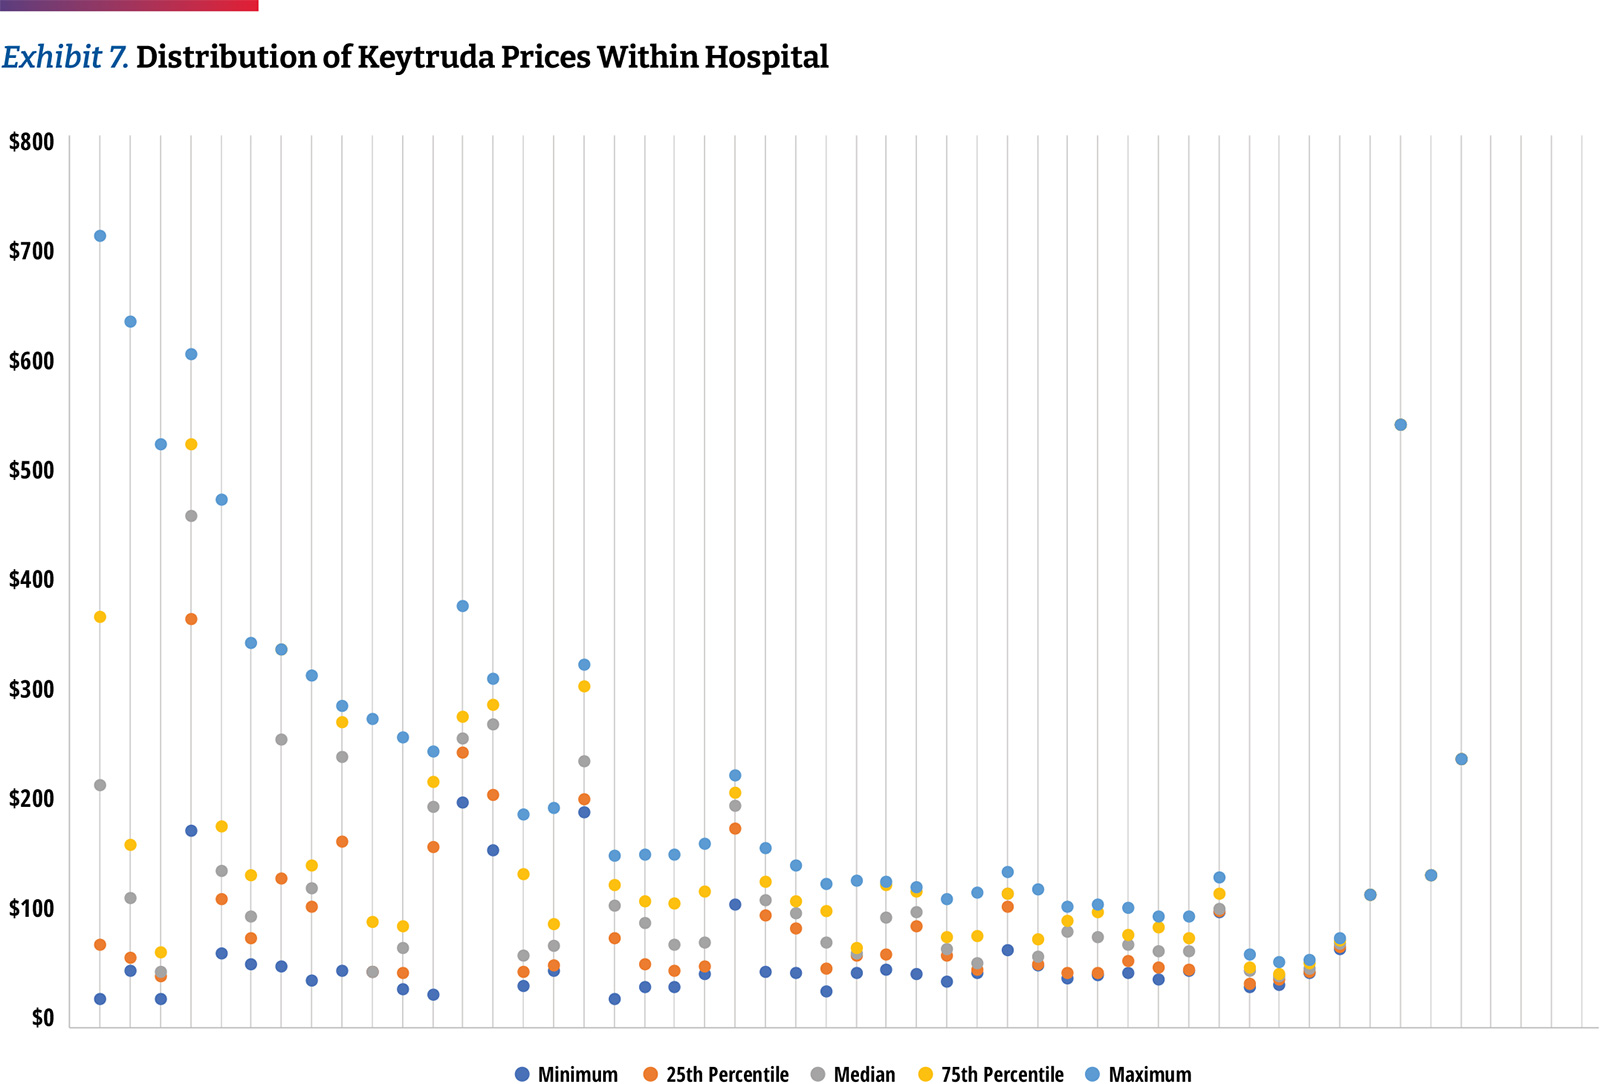
Differences are not only seen among hospitals, but within the same hospital among different insurers. As an example, the typical price band for Keytruda was ~2.6 times with the lower high to low spread being 30 percent and the highest exceeding seven times. (Exhibit 7)
The reporting requirements of the Hospital Price Transparency Rule offers insurers greater transparency on their relative price compared to other insurers within the same hospital; as such, there may be increased efforts to negotiate agreements to reduce plan costs. The availability of data will influence the degree to which payers incorporate reporting into their negotiation strategy, which may increase if compliance increases among 340B hospitals. However, all negotiating leverage dynamics vary by market and the largest 340B hospitals will likely continue to gain from margins on drugs administered to commercially insured patients.
3
Hospitals Remain Slow to Adopt Biosimilars
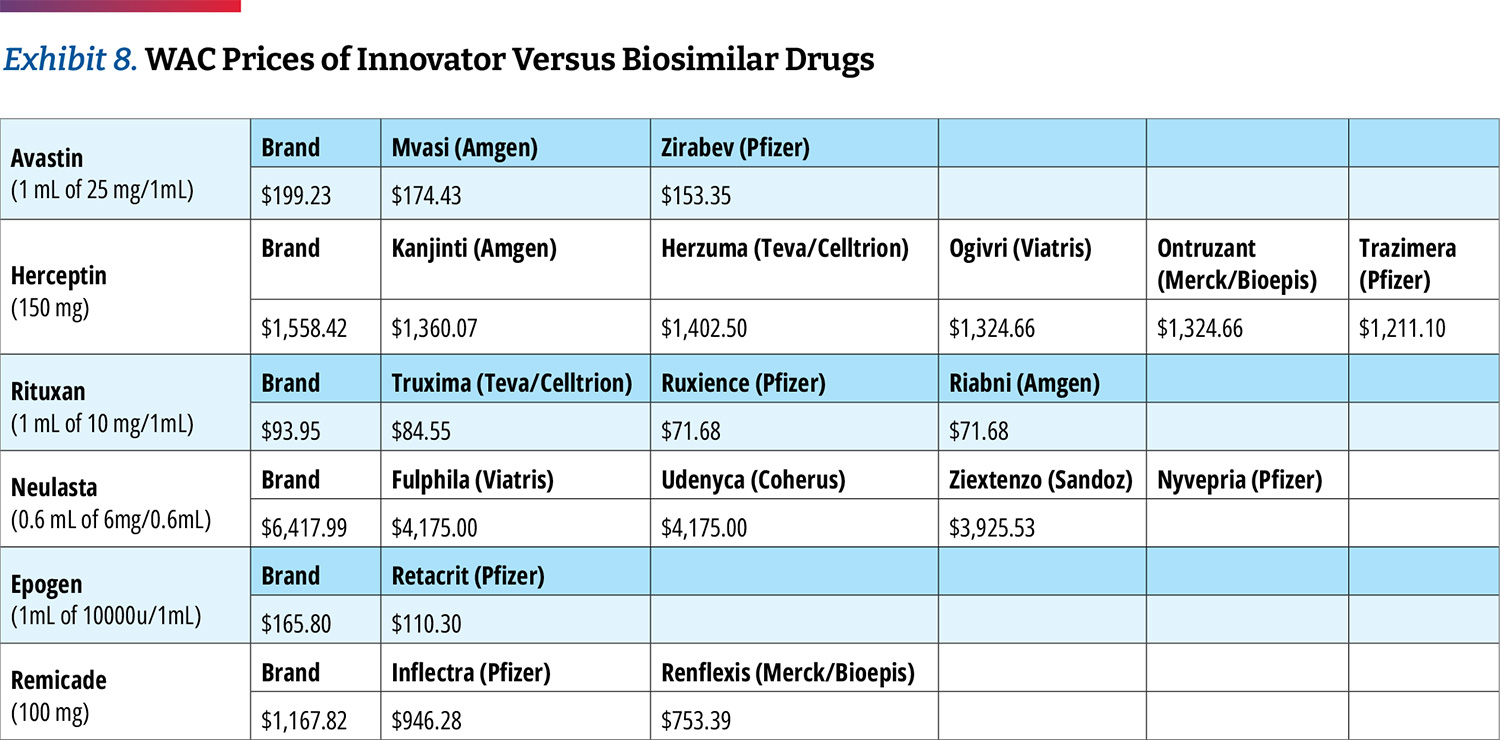
As stated earlier in the analysis, 340B hospitals tend to price drugs at markup to their wholesale acquisition cost (WAC) price. However, most biosimilars have WAC prices that are discounted from the
innovator drug to remain competitive. (Exhibit 8) This may in turn create economic incentives for 340B hospitals to prefer innovator products since their net price would turn higher profits or to mark up biosimilars to the level of innovator drug pricing.
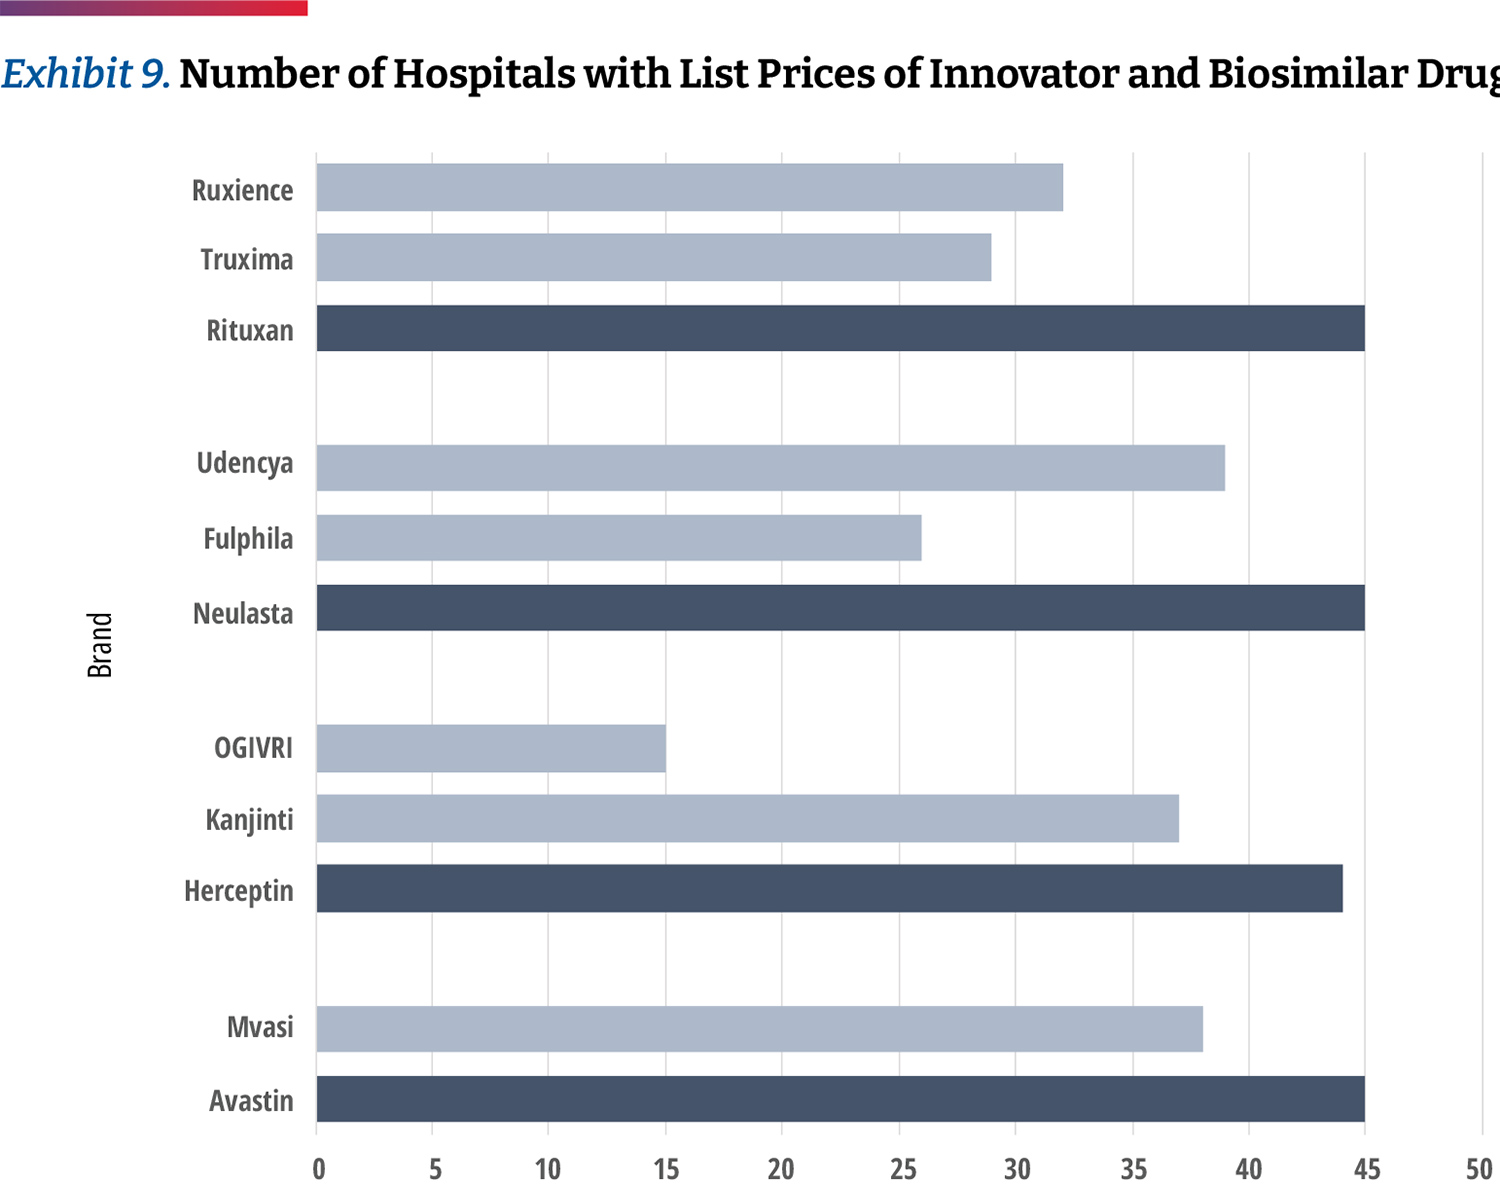
While this analysis does not allow us to see the frequency of each product’s use, we can examine which products 340B hospitals provide negotiated prices for. Our data shows that hospitals report a price for the innovator products more often than biosimilars. (Exhibit 9) For example, 26 percent of hospitals list prices only for Avastin but not its biosimilar product. Of the products studied, Neulasta was the product most commonly listed along with a biosimilar, though there were still 14 percent of hospitals listing prices for only the innovator product. Only 10 hospitals carry all of the biosimilars studied. This may suggest that hospitals are generally still slow to adopt biosimilars.
Cash Paying or Uninsured Patients at 340B Hospitals Do Not Receive Drug Discounts
Based on our analysis, there are clear differences between what different insurers are charged for patients receiving care at 340B hospitals. To more comprehensively understand how patients are affected by this, we also examined prices for cash-paying or uninsured patients. About nine percent of the U.S. population was uninsured in 2021 and the mandate of the 340B designated hospitals includes providing affordable care to this segment.30
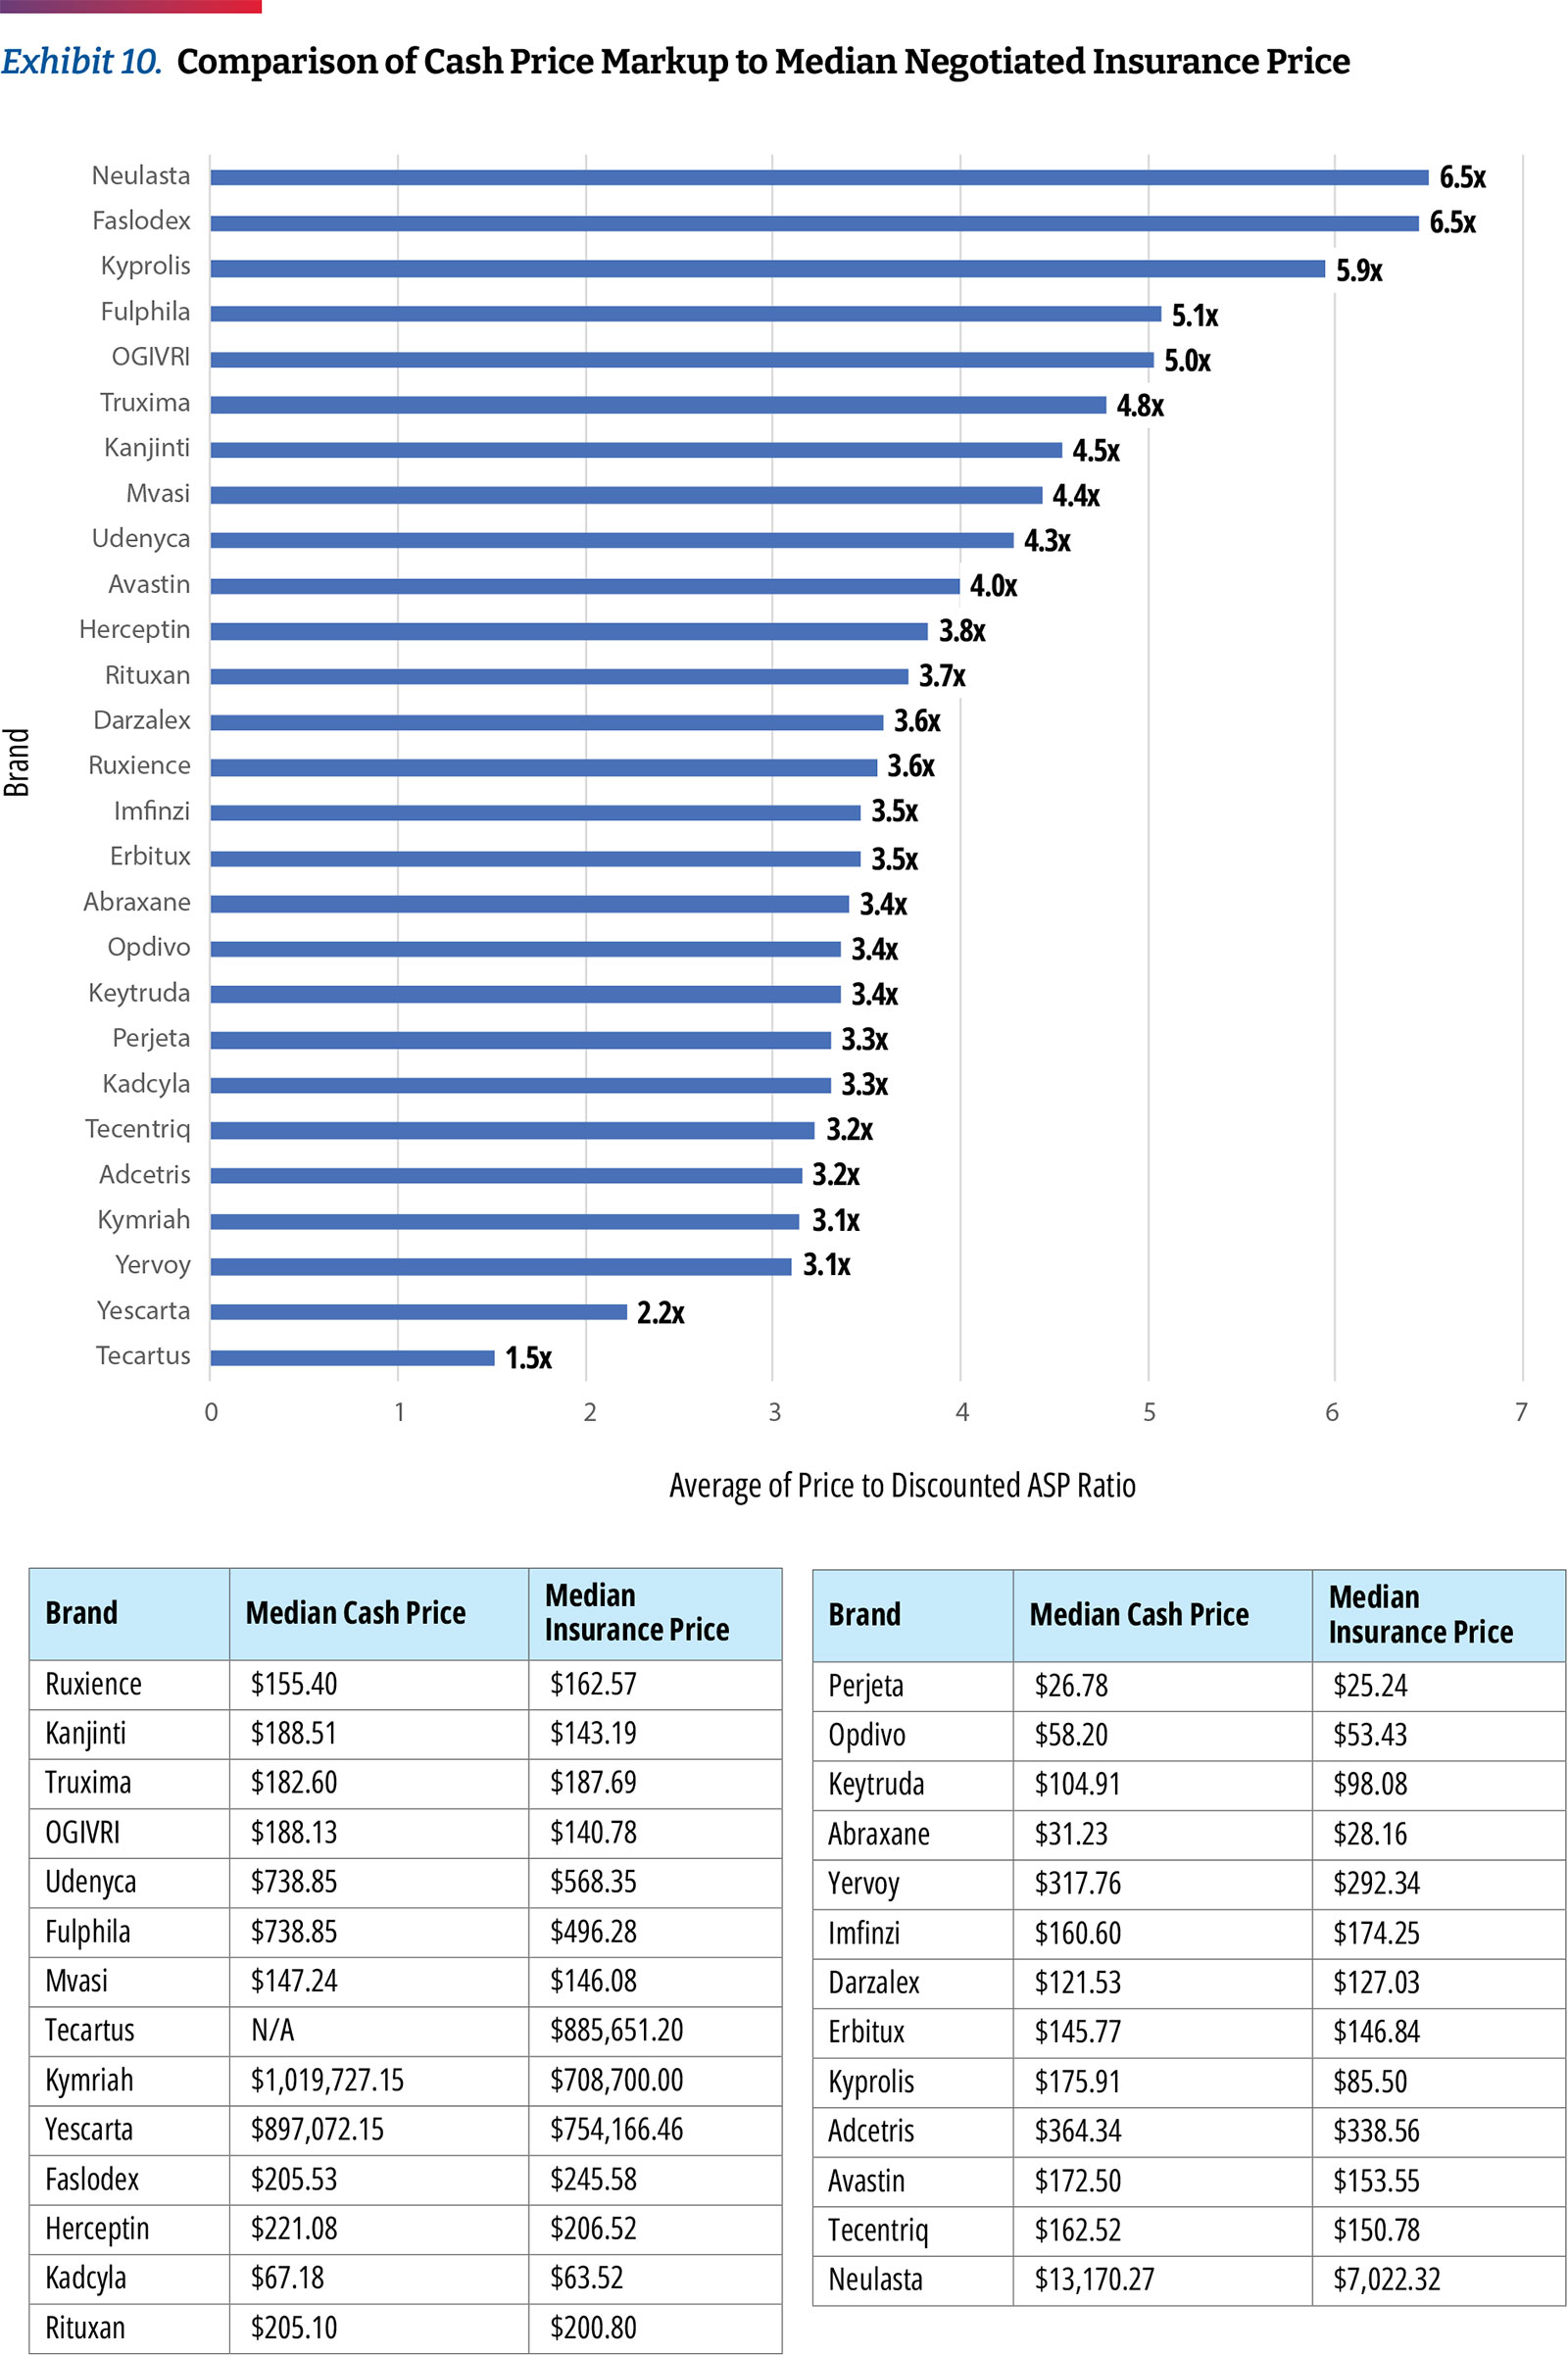
Though hospitals are required under price transparency regulations to report prices for cash-paying customers, our analysis found that very few reported this data in a manner allowing for analysis. Only two of the 49 hospitals share clear cash prices. In our analysis of those prices, we found that hospitals charge approximately 3.2 times ASP for commercial plans and charge cash-paying patients 3.0 times ASP. (Exhibit 10)
Based on the limited sample, additional data would be necessary to draw further conclusions around the cash prices used by top 340B hospitals. However, in a previous analysis that assessed transparency data from a larger number of hospitals, the findings were similar, showing that cash paying customers were charged nearly the exact same prices as those with commercial coverage.31
Conclusion and Discussion
In this analysis, we observed more dramatic differences in the variance between 340B hospital acquisition costs and the price charged to insurers compared to last year’s analysis. Most notably:
- The spread between the discounted 340B purchase price and the price charged to insurers or patients in 340B hospitals is 4.9 times the median
- The price that 340B hospitals charge insurers relative to their purchase price is substantially higher for commercial insurance compared to Medicare
- 340B hospitals are still slow to adopt lower cost biosimilars
- 340B hospitals are charging cash-paying or uninsured patients similar amounts as they charge commercial insurers
As concerns about the growth of the 340B program increase, calls for pricing transparency on the margins that hospitals make on 340B products increase. While hospital reporting has improved slightly since our previous report, there are still challenges in gathering and analyzing the data published by the top 340B hospitals. Moreover, transparency may not be sufficient to remediate mark-ups among 340B hospitals and further legislative or regulatory changes may be needed.
Endnotes
- CMS, “National Health Expenditures 2020 Highlights,” December 2021,
https://www.cms.gov/files/document/highlights.pdf - Tara Bannow, “Study Suggests A New Harm From Hospital Mergers: Less Price Transparency,” Stat News, June 2022,
https://www.statnews.com/2022/06/07/study-suggests-a-new-harm-from-hospital-mergers-less-price-transparency - Karen Mulligan, “The 340B Drug Pricing Program: Background, Ongoing Challenges and Recent Developments,” USC Leonard Schaeffer Center for Health Policy & Economics, October 2021,
https://healthpolicy.usc.edu/research/the-340b-drug-pricing-program-background-ongoing-challenges-and-recent-developments/ - AHA, “Fast Facts on S. Hospitals, 2022,” January 2022,
https://www.aha.org/system/files/media/file/2022/01/fast-facts-on-US-hospitals-2022.pdf - OPAIS Covered Entity Search conducted on 7/19/2022.
- Rena Conti et al, “Revenues and Profits from Medicare Patients in Hospitals Participating in the 340B Drug Discount Program, 2013-2016,” JAMA Network Open Vol 2, 10 (2019):e1914141,
https://doi.org/10.1001/jamanetworkopen.2019.14141 - Ronny Gal, “Examining Hospital Price Transparency, Drug Profits, and the 340B Program,” Community Oncology Alliance, September 2021,
https://communityoncology.org/featured/hospital-340b-drug-profits-report/ - CMS, “Medicare Program: Hospital Outpatient Prospective Payment and Ambulatory Surgical Center Payment Systems and Quality Reporting Programs Final Rule With Comment Period,” November 2017,
https://s3.amazonaws.com/public-inspection.federalregister.gov/2017-23932.pdf - Chevron deference states that the judiciary defers to the administrative body charged with enacting a statute in the interpretation of that statute—as long as the administrative body’s interpretation is deemed “reasonable.”
- Paige Minemyer, “Appeals Court Ruling Paves Way for Price Transparency Rule to Go Into Effect on Jan 1,” Fierce Healthcare, December 2020,
https://www.fiercehealthcare.com/hospitals/aha-seeks-to-delay-enforcement-trump-admin-s-price-transparency-rule - Richard Pollack, “AHA Letter to Biden-Harris Transition Team on Price Transparency Rule,” American Hospital Association, December 2020,
https://www.aha.org/lettercomment/2020-12-21-aha-letter-biden-harris-transition-team-price-transparency-rule - Victoria Bailey, “Only 14% of Hospitals Met Price Transparency Rule Compliance,” Revcycle Intelligence, February 2022,
https://revcycleintelligence.com/news/only-14-of-hospitals-met-price-transparency-rule-compliance - Ronny Gal, “Examining Hospital Price Transparency, Drug Profits, and the 340B Program,” Community Oncology Alliance, September 2021,
https://communityoncology.org/featured/hospital-340b-drug-profits-report/ - CMS, “Medicare Program: Hospital Outpatient Prospective Payment and Ambulatory Surgical Center Payment Systems and Quality Reporting Programs: Price Transparency of Hospital Standard Charges; Radiation Oncology Model,” November 2021,
https://www.federalregister.gov/documents/2021/11/16/2021-24011/medicare-program-hospital-outpatient-prospective- payment-and-ambulatory-surgical-center-payment - CMS, “Hospital Price Transparency Notice of Imposition of a Civil Monetary Penalty (CMP) to Northside Hospital Atlanta,” June 2022,
https://www.cms.gov/files/document/notice-imposition-cmp-northside-hospital-atlanta-6-7-22finalredacted.pdf - CMS, “Hospital Price Transparency Notice of Imposition of a Civil Monetary Penalty (CMP) to Northside Hospital Cherokee,” June 2022,
https://www.cms.gov/files/document/notice-imposition-cmp-northside-hospital-cherokee-6-7-22finalredacted.pdf - Karen Mulligan, “The 340B Drug Pricing Program: Background, Ongoing Challenges and Recent Developments,” USC Leonard Schaeffer Center for Health Policy & Economics, October 2021,
https://healthpolicy.usc.edu/research/the-340b-drug-pricing-program-background-ongoing-challenges-and-recent-developments/ - http://www.drugchannels.net/2022/08/the-340b-program-climbed-to-44-billion.html
- http://www.drugchannels.net/2022/08/the-340b-program-climbed-to-44-billion.html
- http://www.drugchannels.net/2022/08/the-340b-program-climbed-to-44-billion.html
- HRSA, “Contract Pharmacy Services,”
https://www.hrsa.gov/opa/implementation-contract - Ted Okon, “Hospitals and For-Profit PBMs Are Diverting Billions in 340B Savings From Patients in Need,” Stat News, July 2022,
https://www.statnews.com/2022/07/07/for-profit-pbms-diverting-billions-340b-savings - GAO, “Federal Oversight of Compliance at 340B Contract Pharmacies Needs Improvement,”
https://www.gao.gov/assets/gao-18-480.pdf - Aaron Vandervelde et , “For-Profit Pharmacy Participation in the 340B Program,” BRG, October 2020,
https://media.thinkbrg.com/wp-content/uploads/2020/10/06150726/BRG-ForProfitPharmacyParticipation340B_2020.pdf - Ed Silverman, “Two Dozen States Side With HHS in its Raucous Dispute With Pharma Over a Drug Discount Program,” Stat News, May 2022,
https://www.statnews.com/pharmalot/2022/05/16/hhs-340b-hospitals-prescription-drugs/ - Drug Channels “Specialty Pharmacies and PBMs Hop On the 340B Money Train,”
https://www.drugchannels.net/2019/08/specialty-pharmacies-and-pbms-hop-html - CMS, “Medicare Part B Spending by Drug,”
https://data.cms.gov/summary-statistics-on-use-and-payments/medicare-medicaid-spending-by-drug/medicare-part-b-spending-by-drug - Janssen, “The 2021 Janssen S. Transparency Report,” 2022,
https://transparencyreport.janssen.com/ - Ronny Gal, “Examining Hospital Price Transparency, Drug Profits, and the 340B Program,” Community Oncology Alliance, September 2021,
https://communityoncology.org/featured/hospital-340b-drug-profits-report/ - HHS Assistant Secretary for Planning and Evaluation, “Health Coverage Changes From 2020-2021,” January 2022,
https://aspe.hhs.gov/sites/default/files/documents/ed44f7bb6df7a08d972a95c34060861e/aspe-data-point-2020-2021-uninsured.pdf - Ronny Gal, “Examining Hospital Price Transparency, Drug Profits, and the 340B Program,” Community Oncology Alliance, September 2021,
https://communityoncology.org/featured/hospital-340b-drug-profits-report/
Examining Hospital Price Transparency, Drug Profits, and the 340B Program 2022
Key Takeaways
- The Community Oncology Alliance (COA) examined the self-reported drug pricing data for 49 of the top acute care disproportionate share hospitals (DSH) participating in the 340B Drug Discount Program (340B) based on a database ranking of their estimated volume of 340B discounts they receive. This accounts for approximately 23 percent of the total estimated 340B discounts realized by all 340B DSH hospitals (referred to as “340 hospitals” in this paper) in 2021. Because the majority of 340B hospitals are still not compliant with government regulations requiring that they report services and drug pricing data for public use, we had to examine 117 of the top 340B hospitals to arrive at the 49 hospitals used in this study.
- 340B hospitals’ own self-reported pricing data reveals that they price the top oncology drugs at 4.9 times their 340B acquisition costs, assuming a 34.7 percent discount, which is a conservative estimate based on 340B hospital survey data collected by the Centers for Medicare & Medicaid Services (CMS). This is the median drug price mark-up of the oncology drugs studied and differs materially by drug. The lowest average markup was 3.2 times (Kymriah) and the highest was 11.3 times (Faslodex). When the median markup is calculated after excluding the three CAR T products, the median markup is slightly higher at 5.0 times 340B hospital acquisition costs.
- Hospitals remain slow to adopt biosimilars. For certain products, up to 26 percent of hospitals were found to only list prices for an innovator product but not its biosimilar and only 10 hospitals carry all of the biosimilars studied. This may suggest that hospitals are generally still slow to adopt lower priced biosimilars rather than the more expensive innovator drugs.
- Cash paying patients, of whom many may be uninsured, receiving care at 340B hospitals do not seem to receive discounts on their drugs. Unfortunately, only two of the 49 hospitals with compliant reporting data shared cash prices, but for those we found that hospitals charge approximately 3.2 times Average Sales Price (ASP) for commercial plans and charge cash-paying patients 3.0 times ASP. These trends are consistent with prior findings that hospitals charge nearly the same price for cash paying customers as those with commercial insurance coverage.
Background
Hospital spending has continued to grow rapidly (by more than six percent annually), both before and during the pandemic, and most recently represented $1.3T, equivalent to 31 percent of total national health care spending and almost seven percent of the U.S. Gross Domestic product.1 The steady growth and consolidation of the hospital sector has led a range of stakeholders to demand more transparency and accurate price reporting to better inform decision-making.2 It has also raised serious questions about the degree to which deep 340B Drug Pricing Program discounts may have fueled this s growth and consolidation.3
Originally established to help a relatively small group of safety-net hospitals spread scarce resources, the 340B program is now seen as a major revenue source by 44 percent of the nation’s hospitals, particularly in cases when they utilize the discount program on patients with insurance and retain the spread between the deeply discounted 340B price and insurance reimbursement.4,5 There is no clear definition of eligible 340B patients and there are no requirements for 340B hospitals to pass savings to patients, though there is an implicit expectation that these facilities would reinvest the funds to support care for patients in need of financial assistance. Yet, concerns about the lack of transparency into how much money 340B hospitals generate from the program or how they use it have also augmented the calls for increased hospital price reporting.6
Under the federal Price Transparency Rule that went into effect in January 2021, hospitals are required to disclose their standard charges and CMS is responsible for evaluating and enforcing hospital compliance with the requirements prescribed in the rule. In September 2021, the Community Oncology Alliance (COA) commissioned a report7 that highlighted concerns around hospital compliance with transparency regulations and analyzed potential hospital drug profits within the 340B program. The report revealed the aggressive pricing tactics taken by hospitals, including a high spread between 340B purchase price and the prices charged to insurers and patients. The report noted that 340B hospitals maintain high prices for drugs even as acquisition prices decline, pricing was inconsistent between hospitals, there was slow adoption of biosimilars, and cash-paying customers were charged the same prices as insurers, a median of 3.8 times their acquisition costs.

Since the September report, some hospitals that had previously not reported payer price data have now made this information public, providing an opportunity not only to refresh the results of the previous analysis but also to look closer at the top 340B hospitals in terms of estimated 340B “profits.”
The availability of additional transparency data allows for more in-depth review and comparisons. This year, COA has refreshed the initial analysis with a more targeted approach. In this update, we focus on a subset of top 340B hospitals (based on the volume of estimated 340B discounts received) and a targeted list of highly utilized oncology products. In this report, COA discusses recent 340B litigation and its impact on hospitals and hospital compliance with transparency requirements, suggestions to improve hospital price transparency reporting data, and hospital-reported 340B drug prices and profits.
Recent 340B Litigation and Its Impact on Hospitals
In 2018, the Department of Health and Human Services (HHS) reduced reimbursement rates for Medicare Part B drugs acquired through the 340B program from ASP+six percent to ASP-22.5 percent, with exemptions for certain types of hospitals. The change was recommended by the Medicare Payment Advisory Commission (MedPAC) because statute requires Medicare reimbursement for Part B in hospital outpatient departments (HOPDs) to be set at average acquisition cost. CMS had been using ASP+six percent as a proxy for average acquisition cost, which according to MedPAC, far exceeds the acquisition costs for 340B entities. In the CY 2018 Outpatient Prospective Payment System (OPPS) final rule, CMS noted that the reductions in reimbursement rates for 340B-acquired Part B drugs better reflect the resources used to acquire drugs and would provide Medicare beneficiaries with lower co-pays. The rule also noted that 340B discounts may lead to unnecessary utilization and potential overutilization of drugs by 340B eligible hospitals, in addition to the rapid growth of the 340B program.8
As a result, the American Hospital Association (AHA) filed suit against HHS, claiming that the agency exceeded its statutory authority because the method used to adjust Part B reimbursement rates under the 340B program was not specified in statute. The U.S. District Court of the District of Columbia ruled in AHA’s favor, which prompted HHS to conduct a survey in April 2020 on drug acquisition costs among 340B hospitals for calendar years (CYs) 2018 and 2019. HHS later reported that the survey data found higher discounts on 340B drug acquisition — 34.7 percent — than discounts underlying the reimbursement rate set in 2018, but nonetheless announced its intent to retain the payment rate of ASP-22.5 percent in every year since. The U.S. Court of Appeals for the D.C. Circuit then overturned the district court’s ruling in favor of HHS, stating that the reduction in reimbursement rates was permissible under Chevron deference and the Supreme Court of the United States (SCOTUS) agreed to hear the case.9
In June 2022, SCOTUS issued its opinion in AHA v. Becerra, concluding that HHS can set reimbursement rates based on average price and it is permissible for the agency to adjust prices. However, SCOTUS ruled that HHS may not vary reimbursement rates for 340B hospitals without first conducting a survey of hospital drug acquisition costs. As a result, the court ruled that HHS acted unlawfully when it reduced reimbursement rates for 340B hospitals for 2018 and 2019, prior to the survey of 2020.
The court ruled that HHS can set reimbursement rates for outpatient drugs in two ways. Under option 1, HHS can set reimbursement rates based on hospitals’ average acquisition costs for each drug and can vary reimbursement rates by hospital group. If HHS does not conduct a survey of hospital acquisition costs and if data are not available, HHS may proceed to option 2. Under option 2, HHS can obtain drug pricing data from drug manufacturers and set reimbursement rates based on the average price for a drug as calculated and adjusted by the HHS Secretary. However, this option does not authorize HHS to vary reimbursement rates by hospital group. Instead, HHS must set uniform reimbursement rates for each covered drug, which must be equal to the average price of that drug during that year.
While reimbursement for 340B drugs will remain at ASP-22.5 percent for the remainder of 2022, CMS notes in the CY 2023 OPPS proposed rule that the agency likely plans to return to a reimbursement methodology of ASP+six percent in 2023, offsetting the increased spending on drugs with a decrease to the conversion factor for hospital reimbursement. This means that Medicare will pay much more for Part B drugs than what 340B hospitals acquire them for, as will Medicare beneficiaries. Given the mark-ups on drugs by 340B hospitals in the commercial sector, as well as with uninsured patients, the hospitals will have even more incentive to use more drugs and more expensive drugs.
Assessing Hospital Compliance with CMS Transparency Regulations
As part of the Affordable Care Act (ACA), Congress enacted section 2718(e) of the Public Health Service Act, which requires each hospital to “make public (in accordance with guidelines developed by the Secretary of the Department of HHS) a list of the hospital’s standard charges for items and services provided by the hospital.” CMS initially required hospitals to make their list prices available (the “chargemaster”) and subsequently revised its guidance in November 2019 to capture additional data points related to pricing.
The finalized CMS hospital price transparency regulation requires that hospitals publish, among other items, a “machine-readable” file containing prices for all “items and services” provided by the hospital to patients for which the hospital has established a standard charge. These published prices must include (i) the chargemaster price, as in prior regulation, (ii) the price for cash paying customers, (iii) the de-identified minimum and maximum negotiated prices and, critically, (iv) the payer-specific negotiated charges, which is the rate that a hospital has negotiated with each third-party payer.
340B drug purchases have risen from $4B per year in 2007-2009 to $38B in 2021, increasing by $6B alone from 2020 to 2021. Hospitals account for 87 percent of 340B purchases.
The hospital industry has heavily lobbied against the regulation during its notice and comment period and the AHA challenged the rule in court, arguing the law only mandates the publication of chargemaster prices. However, the court ruled in favor of CMS, and the new regulation went into effect on January 1, 2021.10
Since the regulation came into effect, the AHA has continued to argue for its cancellation and leniency in enforcement.11 The regulation included a civil penalty for non-compliance of up to $300 per day ($109,500 annually) — an insignificant amount for many U.S. hospitals that did not appear to compel broad compliance. In fact, in early 2022, only 14 percent of hospitals complied with CMS’ hospital price transparency regulation.12 This is only slightly higher than the 11 percent of 340B hospitals that were found to be compliant in 2021.13 In the CY 2022 rulemaking cycle, CMS finalized modifications to the civil penalty for non-compliance to $300/day for hospitals with less than 30 beds and a penalty of $10/bed/day for hospitals with greater than 30 beds, with a maximum daily penalty of $5,500. Under this approach, penalties would range from $109,500–$2,007,500 per hospital.14 To date, only two hospitals have been fined for noncompliance.15, 16
Concerns about the rapid growth of the 340B program have led to calls for greater transparency into the margins hospitals make on 340B products and the way they use these funds to support patient care and affordability. For example, between 2000 and 2020, the total number of covered entities and their child sites participating in the 340B program rose from approximately 8,100 to approximately more than 50,000, with 340B hospitals accounting for ~60 percent of sites in 2020. 340B drug purchases have risen from $4B per year in 2007-2009 to $38B in 2021, increasing by $6B alone from 2020 to 2021.17, 18 The $44B in 2021 340B drug purchases equates to $94B valued at drug list prices, which is about 14 percent of the total.19 Hospitals account for 87 percent of 340B purchases.20 The availability of transparent hospital prices offers an opportunity to better inform both the debate on 340B hospitals and patients who seek medical care.
Moreover, the government allows 340B participants without pharmacies to distribute drugs to patients via third-party pharmacies known as contract pharmacies, which also have been subject to increased scrutiny.21, 22 Until 2010, 340B contract pharmacies were predominantly independently-owned, local community pharmacies, but by 2018 about 75 percent of them were chain pharmacies.23 The problem began in 2010 when the agency tasked with overseeing the 340B program, the Health Resources and Services Administration, said all 340B participants, even those with their own pharmacies, could contract with an unlimited number of third-party pharmacies. Between April 1, 2010, and April 1, 2020, the number of contract pharmacy arrangements increased 4,228 percent, and they now account for 28 percent of 340B revenue.24, 25 The five largest specialty pharmacies account for more than 20 percent of total contract pharmacy relationships with 340B entities and are also owned by, or corporately affiliated with, pharmacy benefit managers (PBMs).26 This has allowed 340B hospitals, PBMs, and their affiliated for-profit contract pharmacies to expand their reach and continue fueling 340B program growth and increasing their profits through the program at the expense of patients in need.

What We Did: Methodology and Data Limitations
We selected a list of 27 oncology treatment and supportive drugs to study. The drugs were selected primarily based on being the highest dollar expenditure for Medicare Part B cancer drugs in 2019 augmented with lower expenditure drugs sharing the same active ingredient, either generic or biosimilar. 27
In a previous analysis, a list of 1,087 340B hospitals was accessed and analyzed whether they complied with the updated (January 1, 2021) hospital transparency regulation or if they only provided chargemaster data required by the pre-2021 regulation. When price data relevant to the regulation was found in the data file (e.g., minimum price, cash price), they were considered as “attempting to comply.” In this analysis, using the same list of 1,087 acute care 340B hospitals, we took the initial step of arranging hospitals by their share of operating costs (of all 340B hospitals) from highest to lowest. Assuming that operating costs are proportional to 340B discount dollars received, this ordering of sites also represents the order of hospitals with highest to lowest share of 340B discounts. Working down the list to identify ~50 hospitals with compliant files available, it required review of 117 of the top 340B hospitals to identify 49 useful hospital price transparency files for this analysis. (One hospital of the 50 was ultimately not used due to incomplete and questionable data.) (Exhibit 1) The 49 hospitals analyzed represent 23 percent of the total 340B discounts realized by all 340B DSH hospitals in 2021, which on a per hospital basis is an estimated $86 million to $162 million. It is notable that only eight of the top 20 340B DSH hospitals with the highest estimated 340B discounts reported useful transparency data.
We note that the 340B discount percentage used in this analysis is the average discount percentage that CMS arrived at in its 2020 survey of 340B hospitals. However, as CMS notes, and has been referenced elsewhere, this is a conservative average 340B discount. In fact, based on actual 340B purchase data, it has been recently estimated that 340B discounts off of drug list prices are at least 53 percent. As a result, findings of this study on drug price mark-ups are significantly underestimated.

Description of the Dataset Analyzed
We obtained 41,704 individual negotiated prices from the hospitals own self-reported data files, each reflecting a unique combination of hospital-payer-drug. Only two of the 49 fully compliant hospitals disclosed prices for all of the 27 oncology drugs that we examined, and we presume that each hospital carries a subset. Our analysis found that the median hospital has negotiated prices for 22 of the drugs. We obtained negotiated prices from 43 hospitals (median number of hospitals with at least one price per drug). (Exhibit 2)
To illustrate the variability in terms of data available, we found that prices were available for Abraxane for all hospitals. In addition, Faslodex and Yervoy were carried by 48 of 49 hospitals. Prices were also commonly available for Kyprolis, Opdivo, and Keytruda. Meanwhile, the vast majority of hospitals did not have prices for CAR T-cell products such as Tecartus (only seven out of 49 hospitals), Kymriah, and Yescarta (15 hospitals each). Aside from CAR T-cell products, Herceptin (15 hospitals), Neulasta (26 hospitals), and Rituxan (29 hospitals) were among the least reported prices.
Examining Hospital-Reported 340B Drug Prices, Markups, and Profits
The discounts that 340B entities negotiate with manufacturers are not publicly available and vary by hospital and by drug. The minimum required discount, which determines the 340B ceiling price, is calculated based on a formula tied to either Best Price or to the 23.1 percent mandatory discount in Medicaid. However, most 340B discounts can be higher, including if the drug price is increased above the rate of inflation.

In Exhibit 3, we calculated the average 340B hospital markup by comparing each hospital’s negotiated prices for insured outpatients to the published April 2021 ASP Drug Pricing File, discounted by 34.7 percent, which is based on CMS survey data released in the OPPS CY 2021 final rule. However, other sources suggest that average 340B discounts could be much higher than 34.7 percent. For example, Janssen’s 2021 U.S. price transparency report estimates average 340B discounts to be 66 percent.28 Therefore, the use of a standard 34.7 percent discount in our calculations represents a conservative approach to assessing markup trends.
Based on the assumption of a 34.7 percent discount, the hospital transparency data reveals that 340B DSH hospitals price drugs at a median of 4.9 times their 340B acquisition costs, and the price markup differs materially by drug. The lowest average markup was 3.2 times (Kymriah) and the highest was 11.3 times (Faslodex). If median markup is calculated after excluding the three CAR T-cell products, the median markup is slightly higher, at 5.0 times 340B acquisition costs. As high-cost cell and gene therapies enter the market, with prices ranging from several hundred thousand dollars to more than $2M, some approaches to contracting for drug reimbursement may need to be altered. However, the available price transparency data shows that hospital providers are realizing significant markups on these products, with an opportunity for enormous margins, especially if acquired through the 340B program. (Exhibit 4)
Similar to our prior analysis, the results of this study confirm the highest markup is for biosimilars and their reference drugs.29 Hospitals are purchasing biosimilars and their reference products at a notably discounted rate in comparison to their price. When observing the relationship between ASP and 340B prices, we found more substantial average markups of approximately 5.5 times between biosimilars and their reference products.

Key Findings on 340B
1
340B Hospital Gains From Commercial Plans
As discussed previously, CMS reimburses non-340B hospitals at six percent above the average cost of the drug (i.e., ASP+six percent), before a two percent sequestration cut. Between 2018-2022, 340B hospitals were reimbursed at the lower rate of ASP-22.5 percent (before sequestration) and the government estimates that their drug purchase price averages 34.7 percent of ASP. In 2023, CMS expects to return to a methodology of reimbursing 340B hospitals at ASP+six percent for 340B-acquired drugs. This analysis shows that commercial insurers are charged 4.9 times the acquisition price of oncology drugs by top 340B hospitals, presenting the opportunity for major profits from such significant margins.

To help exemplify this markup in real dollars, consider the case of trastuzumab (Herceptin), a monoclonal antibody used to treat breast and stomach cancers. An independent community oncology practice (or non-340B hospital) treating a Medicare patient with breast cancer over the course of one year of therapy would purchase Herceptin for $66,107 and be reimbursed $70,073 (ASP+six percent, before sequestration). It would thus make $3,966 in pricing spread for treating that patient. A 340B hospital treating the same patient would purchase the same amount of Herceptin at $43,168 (34.7 percent lower than ASP) and be reimbursed by Medicare at the same level of ASP+six percent (total $70,073), assuming CMS finalizes plans to revert to this payment methodology in 2023. The hospital would thus make $26,905, approximately 6.8 times the amount of non-340B providers for the same Medicare patient. A 340B hospital treating a commercial patient with breast cancer over one year will still purchase the drug at $43,168. However, it will now charge the commercial patient’s insurance slightly more than 5.0 times that amount, totaling $217,122 for a spread of $173,954, about 6.5 times more than the spread a hospital would receive for an identical Medicare patient and 43.9 times more than the spread for a community oncology practice or non-340B hospital. (Exhibit 5)
The analysis also shows the significant 340B drug discounts captured by hospitals that may not be passed down to patients. These price markups and opportunities for profit are exacerbated depending on the payer. We looked at the median spread across all 27 products and then compared them to commercial plans. We found that when commercially insured patients are treated at a 340B hospital, the median spread on a product is 7.4 times that for a Medicare patient ($188.54 vs. $25.45).
While 340B hospitals generally purchase drugs within the same narrow price band, there are differences in prices charged between hospitals. When comparing individual hospitals, this analysis found that 8.1 percent of drug prices are less than 0.5 times the median price and 13 percent are more than 2.0 times the median price across hospitals. (Exhibit 6)

2
There Is a Large Spread in Negotiated Prices Between Hospitals and Between Payers Within the Same Hospital
Differences are not only seen among hospitals, but within the same hospital among different insurers. As an example, the typical price band for Keytruda was ~2.6 times with the lower high to low spread being 30 percent and the highest exceeding seven times. (Exhibit 7)
The reporting requirements of the Hospital Price Transparency Rule offers insurers greater transparency on their relative price compared to other insurers within the same hospital; as such, there may be increased efforts to negotiate agreements to reduce plan costs. The availability of data will influence the degree to which payers incorporate reporting into their negotiation strategy, which may increase if compliance increases among 340B hospitals. However, all negotiating leverage dynamics vary by market and the largest 340B hospitals will likely continue to gain from margins on drugs administered to commercially insured patients.
3
Hospitals Remain Slow to Adopt Biosimilars
As stated earlier in the analysis, 340B hospitals tend to price drugs at markup to their wholesale acquisition cost (WAC) price. However, most biosimilars have WAC prices that are discounted from the
innovator drug to remain competitive. (Exhibit 8) This may in turn create economic incentives for 340B hospitals to prefer innovator products since their net price would turn higher profits or to mark up biosimilars to the level of innovator drug pricing.


While this analysis does not allow us to see the frequency of each product’s use, we can examine which products 340B hospitals provide negotiated prices for. Our data shows that hospitals report a price for the innovator products more often than biosimilars. (Exhibit 9) For example, 26 percent of hospitals list prices only for Avastin but not its biosimilar product. Of the products studied, Neulasta was the product most commonly listed along with a biosimilar, though there were still 14 percent of hospitals listing prices for only the innovator product. Only 10 hospitals carry all of the biosimilars studied. This may suggest that hospitals are generally still slow to adopt biosimilars.


Cash Paying or Uninsured Patients at 340B Hospitals Do Not Receive Drug Discounts
Based on our analysis, there are clear differences between what different insurers are charged for patients receiving care at 340B hospitals. To more comprehensively understand how patients are affected by this, we also examined prices for cash-paying or uninsured patients. About nine percent of the U.S. population was uninsured in 2021 and the mandate of the 340B designated hospitals includes providing affordable care to this segment.30
Though hospitals are required under price transparency regulations to report prices for cash-paying customers, our analysis found that very few reported this data in a manner allowing for analysis. Only two of the 49 hospitals share clear cash prices. In our analysis of those prices, we found that hospitals charge approximately 3.2 times ASP for commercial plans and charge cash-paying patients 3.0 times ASP. (Exhibit 10)
Based on the limited sample, additional data would be necessary to draw further conclusions around the cash prices used by top 340B hospitals. However, in a previous analysis that assessed transparency data from a larger number of hospitals, the findings were similar, showing that cash paying customers were charged nearly the exact same prices as those with commercial coverage.31
Conclusion and Discussion
In this analysis, we observed more dramatic differences in the variance between 340B hospital acquisition costs and the price charged to insurers compared to last year’s analysis. Most notably:
- The spread between the discounted 340B purchase price and the price charged to insurers or patients in 340B hospitals is 4.9 times the median
- The price that 340B hospitals charge insurers relative to their purchase price is substantially higher for commercial insurance compared to Medicare
- 340B hospitals are still slow to adopt lower cost biosimilars
- 340B hospitals are charging cash-paying or uninsured patients similar amounts as they charge commercial insurers
As concerns about the growth of the 340B program increase, calls for pricing transparency on the margins that hospitals make on 340B products increase. While hospital reporting has improved slightly since our previous report, there are still challenges in gathering and analyzing the data published by the top 340B hospitals. Moreover, transparency may not be sufficient to remediate mark-ups among 340B hospitals and further legislative or regulatory changes may be needed.
Endnotes
- CMS, “National Health Expenditures 2020 Highlights,” December 2021,
https://www.cms.gov/files/document/highlights.pdf - Tara Bannow, “Study Suggests A New Harm From Hospital Mergers: Less Price Transparency,” Stat News, June 2022,
https://www.statnews.com/2022/06/07/study-suggests-a-new-harm-from-hospital-mergers-less-price-transparency - Karen Mulligan, “The 340B Drug Pricing Program: Background, Ongoing Challenges and Recent Developments,” USC Leonard Schaeffer Center for Health Policy & Economics, October 2021,
https://healthpolicy.usc.edu/research/the-340b-drug-pricing-program-background-ongoing-challenges-and-recent-developments/ - AHA, “Fast Facts on S. Hospitals, 2022,” January 2022,
https://www.aha.org/system/files/media/file/2022/01/fast-facts-on-US-hospitals-2022.pdf - OPAIS Covered Entity Search conducted on 7/19/2022.
- Rena Conti et al, “Revenues and Profits from Medicare Patients in Hospitals Participating in the 340B Drug Discount Program, 2013-2016,” JAMA Network Open Vol 2, 10 (2019):e1914141,
https://doi.org/10.1001/jamanetworkopen.2019.14141 - Ronny Gal, “Examining Hospital Price Transparency, Drug Profits, and the 340B Program,” Community Oncology Alliance, September 2021,
https://communityoncology.org/featured/hospital-340b-drug-profits-report/ - CMS, “Medicare Program: Hospital Outpatient Prospective Payment and Ambulatory Surgical Center Payment Systems and Quality Reporting Programs Final Rule With Comment Period,” November 2017,
https://s3.amazonaws.com/public-inspection.federalregister.gov/2017-23932.pdf - Chevron deference states that the judiciary defers to the administrative body charged with enacting a statute in the interpretation of that statute—as long as the administrative body’s interpretation is deemed “reasonable.”
- Paige Minemyer, “Appeals Court Ruling Paves Way for Price Transparency Rule to Go Into Effect on Jan 1,” Fierce Healthcare, December 2020,
https://www.fiercehealthcare.com/hospitals/aha-seeks-to-delay-enforcement-trump-admin-s-price-transparency-rule - Richard Pollack, “AHA Letter to Biden-Harris Transition Team on Price Transparency Rule,” American Hospital Association, December 2020,
https://www.aha.org/lettercomment/2020-12-21-aha-letter-biden-harris-transition-team-price-transparency-rule - Victoria Bailey, “Only 14% of Hospitals Met Price Transparency Rule Compliance,” Revcycle Intelligence, February 2022,
https://revcycleintelligence.com/news/only-14-of-hospitals-met-price-transparency-rule-compliance - Ronny Gal, “Examining Hospital Price Transparency, Drug Profits, and the 340B Program,” Community Oncology Alliance, September 2021,
https://communityoncology.org/featured/hospital-340b-drug-profits-report/ - CMS, “Medicare Program: Hospital Outpatient Prospective Payment and Ambulatory Surgical Center Payment Systems and Quality Reporting Programs: Price Transparency of Hospital Standard Charges; Radiation Oncology Model,” November 2021,
https://www.federalregister.gov/documents/2021/11/16/2021-24011/medicare-program-hospital-outpatient-prospective- payment-and-ambulatory-surgical-center-payment - CMS, “Hospital Price Transparency Notice of Imposition of a Civil Monetary Penalty (CMP) to Northside Hospital Atlanta,” June 2022,
https://www.cms.gov/files/document/notice-imposition-cmp-northside-hospital-atlanta-6-7-22finalredacted.pdf - CMS, “Hospital Price Transparency Notice of Imposition of a Civil Monetary Penalty (CMP) to Northside Hospital Cherokee,” June 2022,
https://www.cms.gov/files/document/notice-imposition-cmp-northside-hospital-cherokee-6-7-22finalredacted.pdf - Karen Mulligan, “The 340B Drug Pricing Program: Background, Ongoing Challenges and Recent Developments,” USC Leonard Schaeffer Center for Health Policy & Economics, October 2021,
https://healthpolicy.usc.edu/research/the-340b-drug-pricing-program-background-ongoing-challenges-and-recent-developments/ - http://www.drugchannels.net/2022/08/the-340b-program-climbed-to-44-billion.html
- http://www.drugchannels.net/2022/08/the-340b-program-climbed-to-44-billion.html
- http://www.drugchannels.net/2022/08/the-340b-program-climbed-to-44-billion.html
- HRSA, “Contract Pharmacy Services,”
https://www.hrsa.gov/opa/implementation-contract - Ted Okon, “Hospitals and For-Profit PBMs Are Diverting Billions in 340B Savings From Patients in Need,” Stat News, July 2022,
https://www.statnews.com/2022/07/07/for-profit-pbms-diverting-billions-340b-savings - GAO, “Federal Oversight of Compliance at 340B Contract Pharmacies Needs Improvement,”
https://www.gao.gov/assets/gao-18-480.pdf - Aaron Vandervelde et , “For-Profit Pharmacy Participation in the 340B Program,” BRG, October 2020,
https://media.thinkbrg.com/wp-content/uploads/2020/10/06150726/BRG-ForProfitPharmacyParticipation340B_2020.pdf - Ed Silverman, “Two Dozen States Side With HHS in its Raucous Dispute With Pharma Over a Drug Discount Program,” Stat News, May 2022,
https://www.statnews.com/pharmalot/2022/05/16/hhs-340b-hospitals-prescription-drugs/ - Drug Channels “Specialty Pharmacies and PBMs Hop On the 340B Money Train,”
https://www.drugchannels.net/2019/08/specialty-pharmacies-and-pbms-hop-html - CMS, “Medicare Part B Spending by Drug,”
https://data.cms.gov/summary-statistics-on-use-and-payments/medicare-medicaid-spending-by-drug/medicare-part-b-spending-by-drug - Janssen, “The 2021 Janssen S. Transparency Report,” 2022,
https://transparencyreport.janssen.com/ - Ronny Gal, “Examining Hospital Price Transparency, Drug Profits, and the 340B Program,” Community Oncology Alliance, September 2021,
https://communityoncology.org/featured/hospital-340b-drug-profits-report/ - HHS Assistant Secretary for Planning and Evaluation, “Health Coverage Changes From 2020-2021,” January 2022,
https://aspe.hhs.gov/sites/default/files/documents/ed44f7bb6df7a08d972a95c34060861e/aspe-data-point-2020-2021-uninsured.pdf - Ronny Gal, “Examining Hospital Price Transparency, Drug Profits, and the 340B Program,” Community Oncology Alliance, September 2021,
https://communityoncology.org/featured/hospital-340b-drug-profits-report/
